Fig. 5.
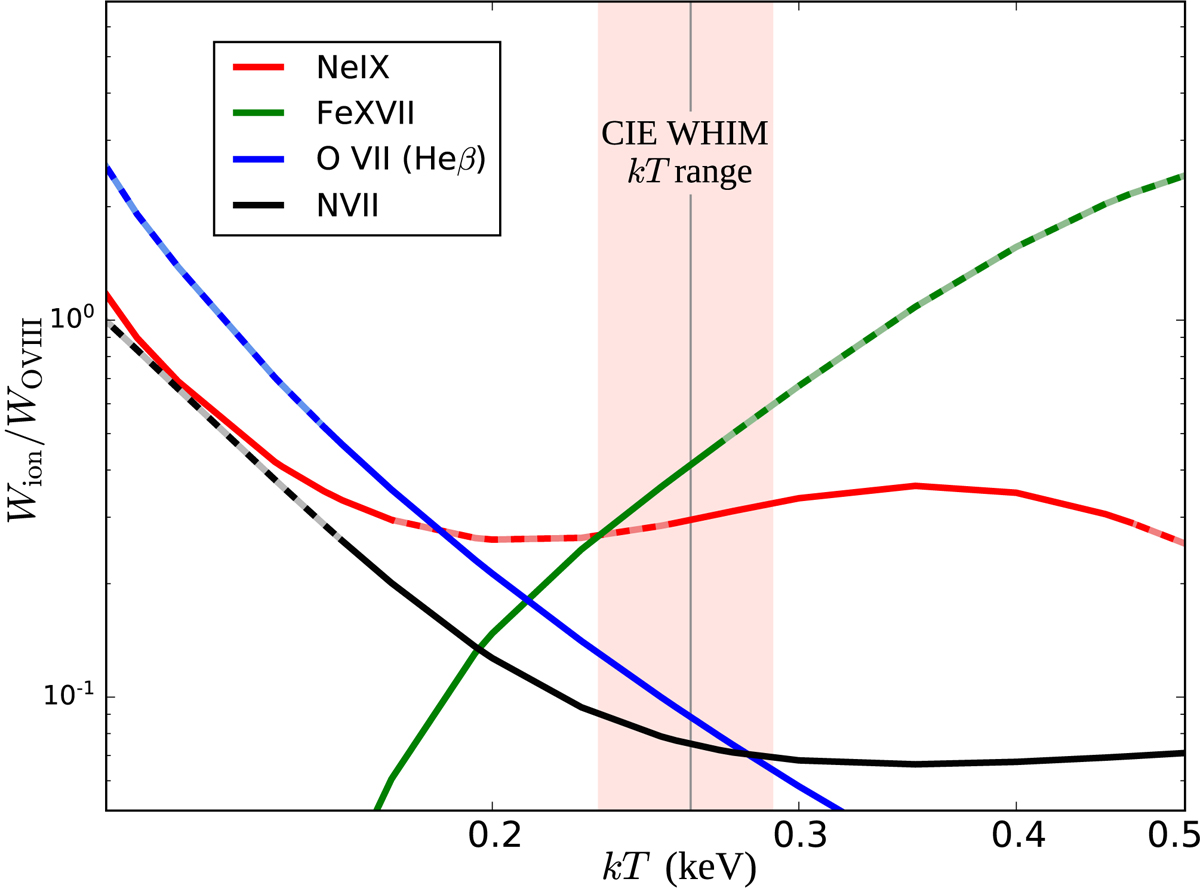
Origin of temperature constraints in CIE WHIM modeling. The figure illustrates CIE model temperature dependencies of various ionic line strengths relative to that of the O VIII Lyman α line. The dashed sections mark the regions where the Wion/WOVIII ratio is inconsistent with the 1σ limits of slab modeling. The ions shown in the figure produce the most important absorption lines in the spectra in the examined wavelength band of 14–28 Å and thus constrain the CIE temperature, marked with the shaded region. The data of the strongest available ionic lines were used to generate this figure.
Current usage metrics show cumulative count of Article Views (full-text article views including HTML views, PDF and ePub downloads, according to the available data) and Abstracts Views on Vision4Press platform.
Data correspond to usage on the plateform after 2015. The current usage metrics is available 48-96 hours after online publication and is updated daily on week days.
Initial download of the metrics may take a while.