Fig. 3.
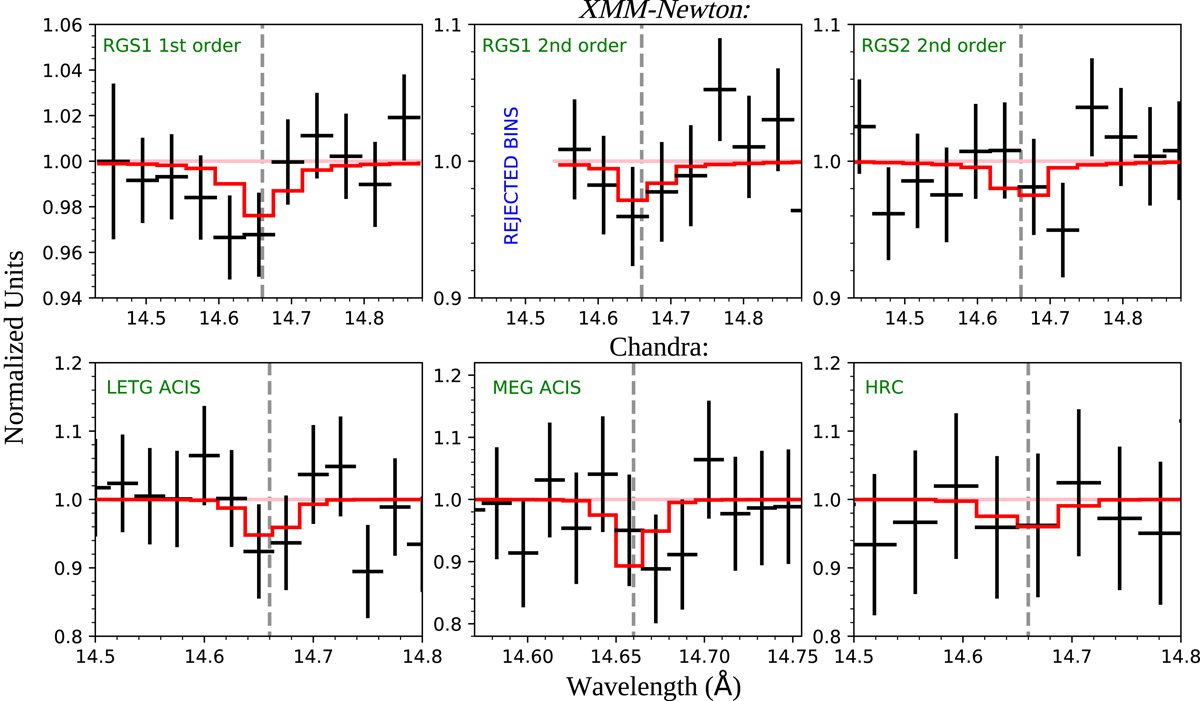
Normalized data (crosses) and the best-fit model (red line) of the z = 0.09017 Ne IX line (the FUV predicted line centroid wavelength is marked with a dashed line) for all the instruments and spectral orders employed. The normalization is done by dividing the spectra by the best-fit continuum model. The best-fit model was simultaneously fitted to RGS1 (first and second dispersion orders), RGS2 (second-order), LETG ACIS (first-order), MEG ACIS (first-order) and HRC data, while the RGS2 first-order data was omitted due to a bad column near the centroid wavelength of the line. The missing bins in RGS1 second-order were rejected by the reduction software due to bad response. The spectral data was rebinned for this illustration to improve the S/N-ratio.
Current usage metrics show cumulative count of Article Views (full-text article views including HTML views, PDF and ePub downloads, according to the available data) and Abstracts Views on Vision4Press platform.
Data correspond to usage on the plateform after 2015. The current usage metrics is available 48-96 hours after online publication and is updated daily on week days.
Initial download of the metrics may take a while.