Fig. 10.
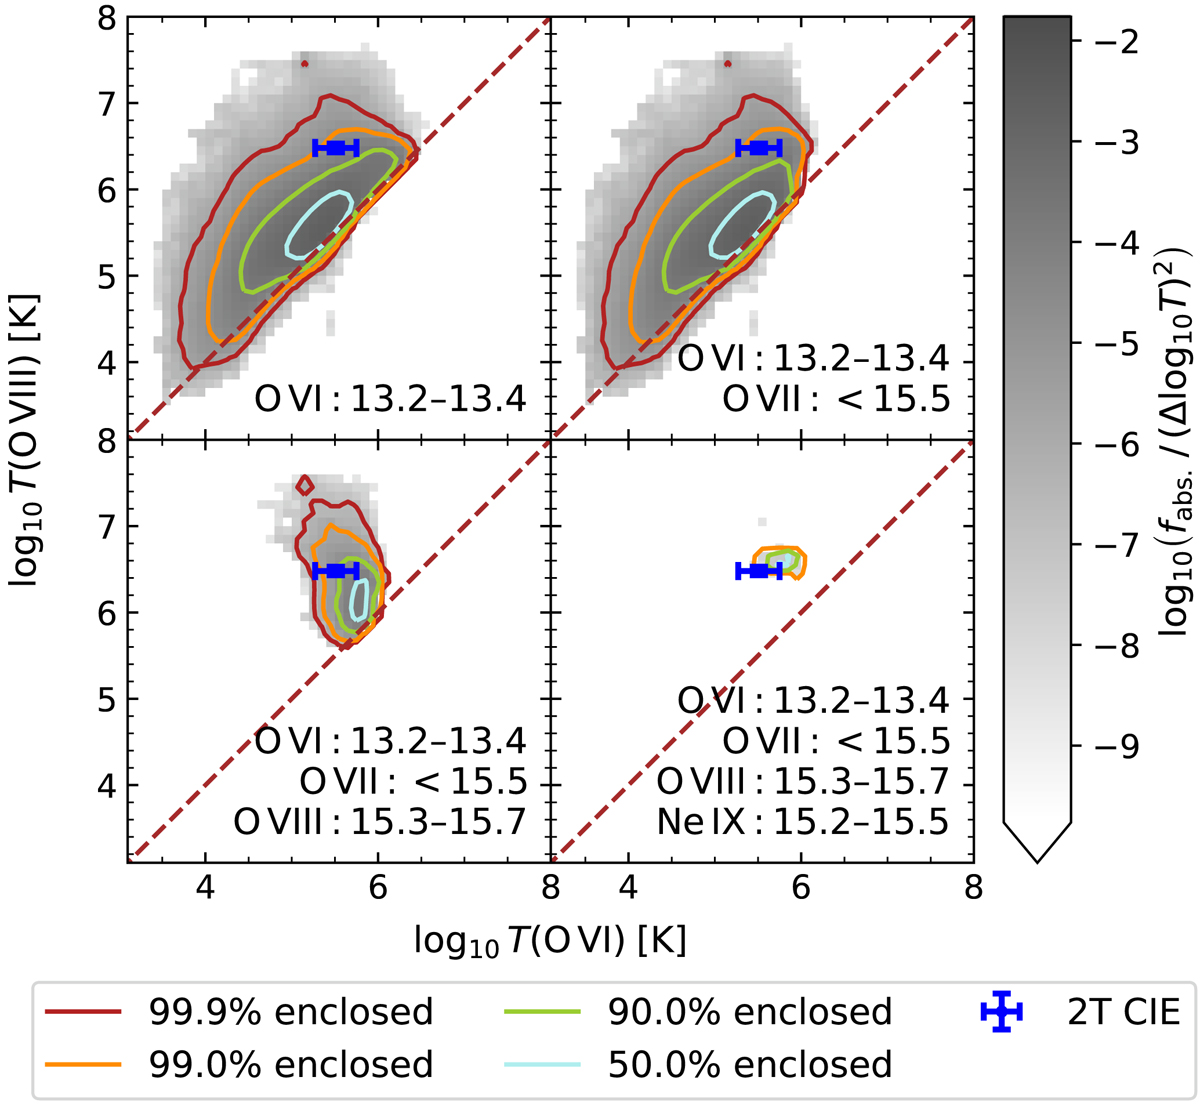
Distribution of O VI-and O VIII-weighted temperatures in counterparts to O VI absorbers (grayscale and contours) according to the EAGLE simulation, compared to the best-fit temperatures at z = 0.09 for the 2-temperature CIE model (warm and hot phase, respectively). From left to right, top to bottom, we show how constraints on the column densities of different ions from the “slab” model affect the temperatures of O VI and O VIII absorbers in EAGLE. Column density ranges are shown in units of log10 cm−2 for the different ions. The O VI constraints are from Tilton et al. (2012). The contours enclose different fractions of the absorbers in each column density selection, as indicated in the legend, while the grayscale shows the fraction of all EAGLE absorbers satisfying the indicated constraints. The brown dashed line indicates where the temperatures are equal. Most absorbers are multiphase and the 2T CIE model is consistent with EAGLE.
Current usage metrics show cumulative count of Article Views (full-text article views including HTML views, PDF and ePub downloads, according to the available data) and Abstracts Views on Vision4Press platform.
Data correspond to usage on the plateform after 2015. The current usage metrics is available 48-96 hours after online publication and is updated daily on week days.
Initial download of the metrics may take a while.