Fig. 1.
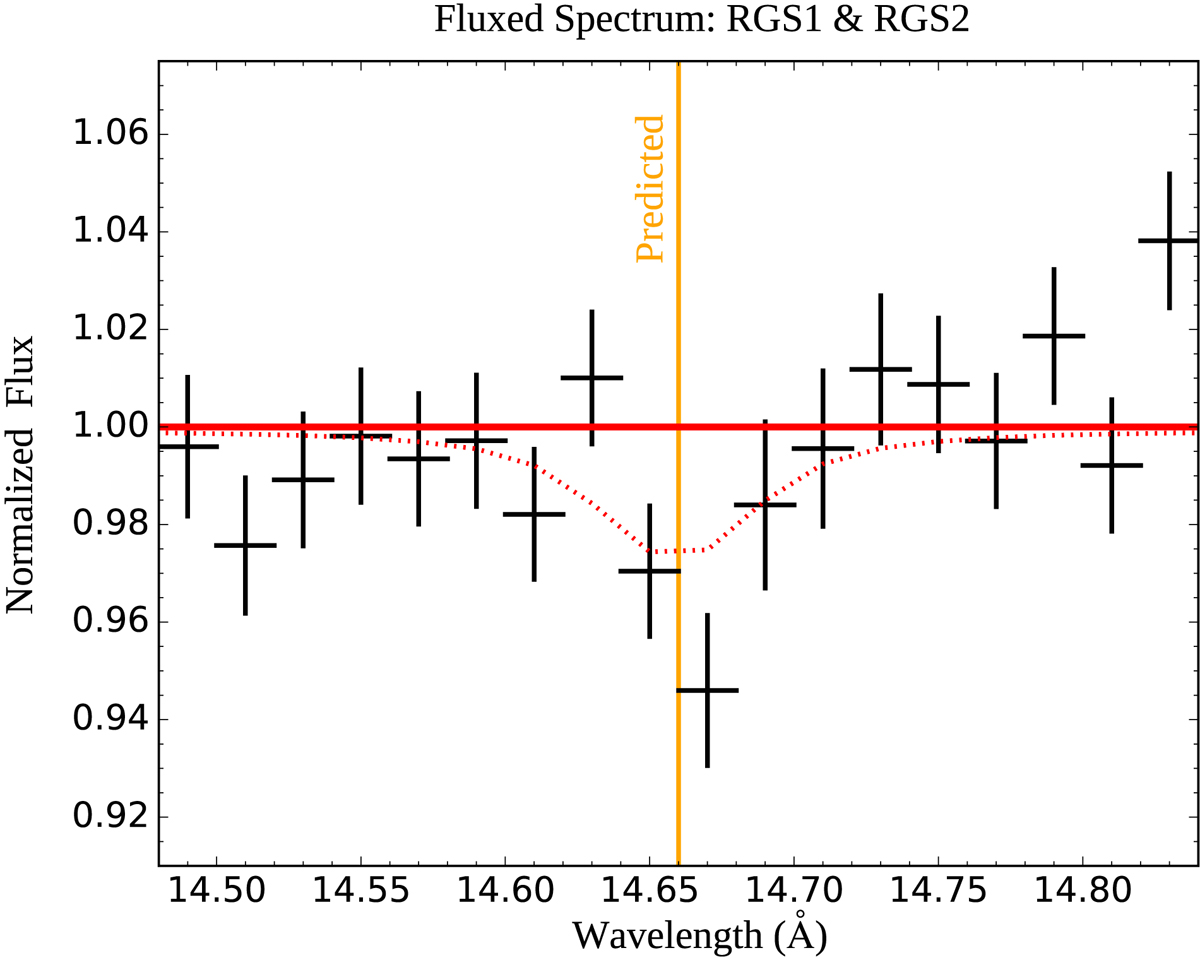
Continuum normalized, co-added fluxed spectrum of RGS1 and RGS2 data at the wavelength around the putative redshift 0.09017 Ne IX Heα absorption line. The FUV predicted line centroid wavelength is shown with the orange line, while the dotted red curve shows the expected absorption signal based on the simultanous fitting of XMM-Newton and Chandra data with the redshifted slab model (Sect. 5.1.1).
Current usage metrics show cumulative count of Article Views (full-text article views including HTML views, PDF and ePub downloads, according to the available data) and Abstracts Views on Vision4Press platform.
Data correspond to usage on the plateform after 2015. The current usage metrics is available 48-96 hours after online publication and is updated daily on week days.
Initial download of the metrics may take a while.