Fig. 5.
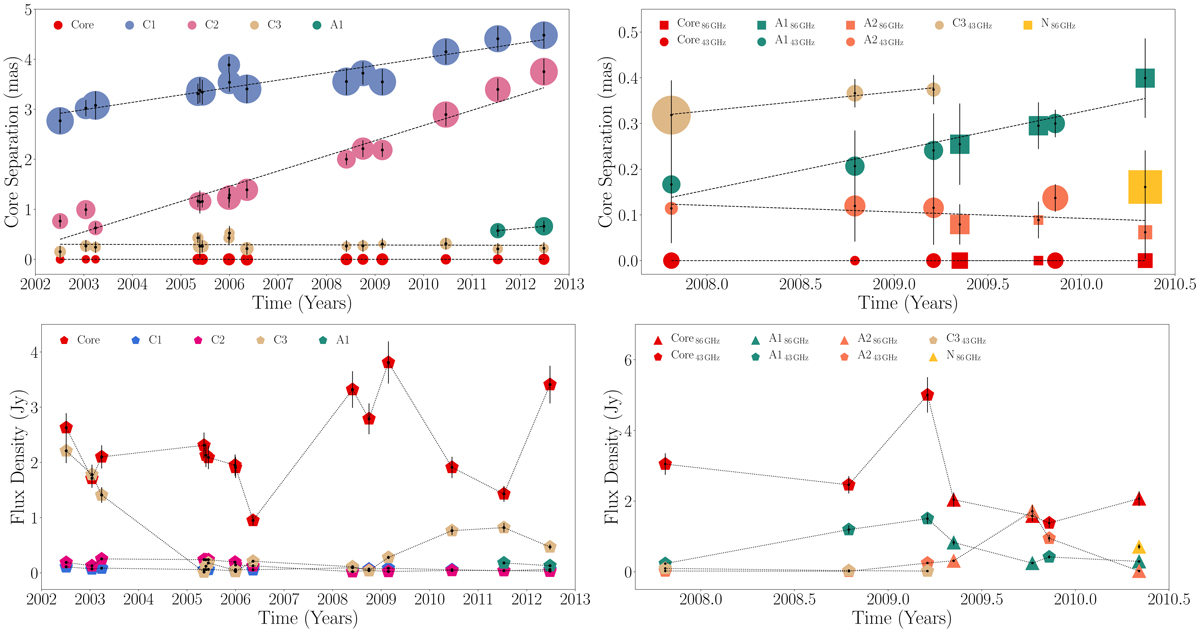
Time evolution of the core distance (top panels) and flux density (bottom panels) of model-fit components at 15 GHz (left panels) and at 43 and 86 GHz (right panels). In the top panels, the size of the data points is set to ∼1/2 of the Gaussian components size. Note here that the time range of 15 and 43–86 GHz data is different. The flux density of the core component showed a maximum in early 2009 at all frequencies. Based on the observational data, in this time range a new component emerges from the core. This new knot seems to “light up” component C3 on its passage, increasing the flux density of the latter.
Current usage metrics show cumulative count of Article Views (full-text article views including HTML views, PDF and ePub downloads, according to the available data) and Abstracts Views on Vision4Press platform.
Data correspond to usage on the plateform after 2015. The current usage metrics is available 48-96 hours after online publication and is updated daily on week days.
Initial download of the metrics may take a while.