Fig. 4.
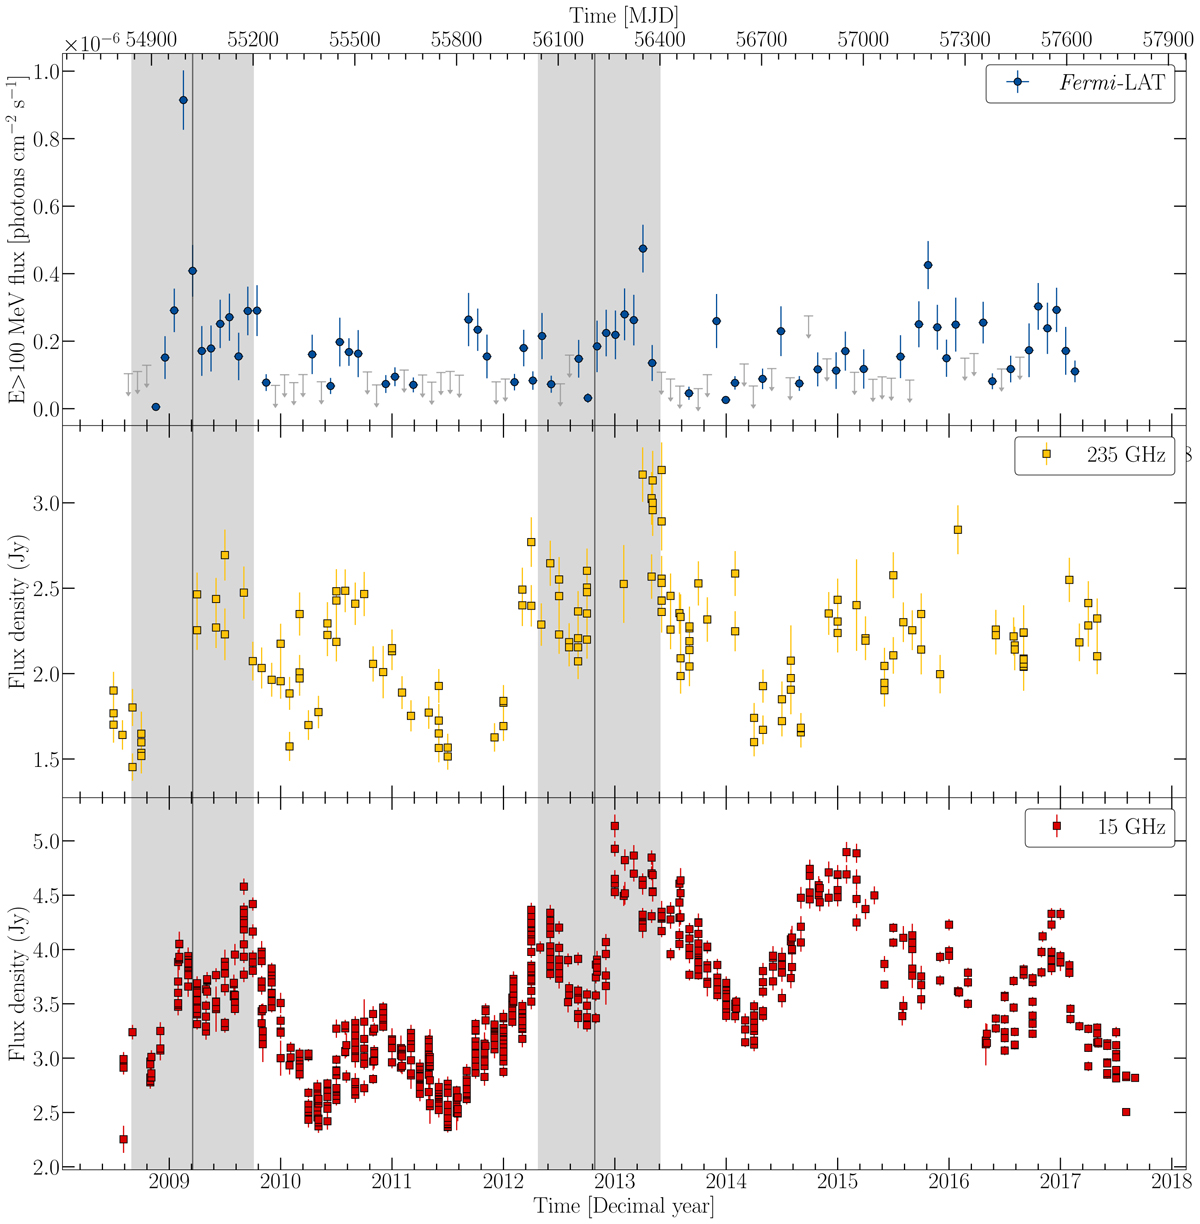
Light curves of the blazar TXS 2013+370 at different frequencies. From top to bottom: Fermi-LAT 0.1–300 GeV with 30 days binning, 235 GHz SMA and 15 GHz OVRO light curves, with flux plotted vs. time. The shadowed areas indicate the ejection time range of the new jet components N (see Fig. 3) and N1 (see Fig. 2) respectively. The vertical lines designate the estimated ejection time, whereas the width of the shadowed areas indicates the uncertainty of this estimation, based on the uncertainty of component A1. We adopt for the N as ejection time the peak of the 43 GHz core flare, whereas for N1, we take the appearance time from the 22 GHz VLBI image. We set for N and N1 the same ejection time uncertainty as the most well-defined feature C2, owing to lack of data.
Current usage metrics show cumulative count of Article Views (full-text article views including HTML views, PDF and ePub downloads, according to the available data) and Abstracts Views on Vision4Press platform.
Data correspond to usage on the plateform after 2015. The current usage metrics is available 48-96 hours after online publication and is updated daily on week days.
Initial download of the metrics may take a while.