Fig. 3.
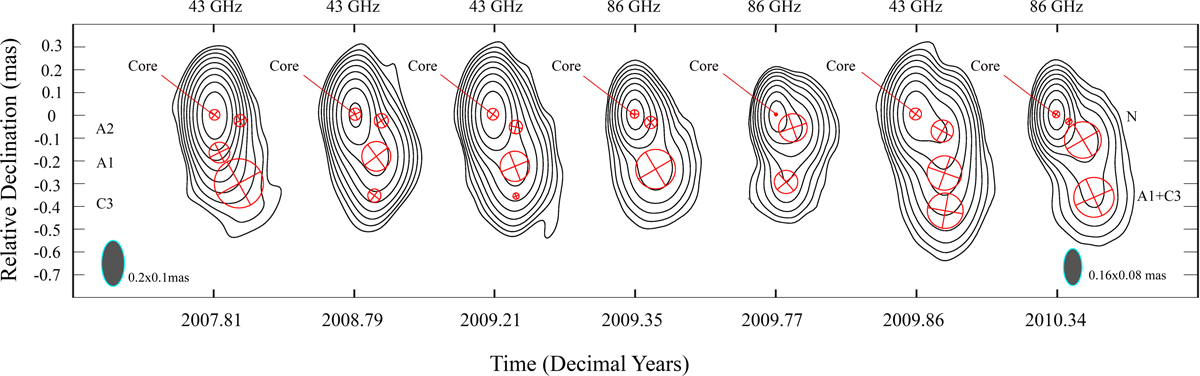
Hybrid model fit images of TXS 2013+370 at 86 and 43 GHz. The data were imaged using uniform weighting, without uv-tapering. At 43 GHz, the images are convolved with a common restoring beam of 0.2 × 0.1 mas, oriented at PA 0°, and the contour levels are set to 0.3, 0.6, 1.2, 2.4, 4.8, 9.6, 19.2, 38.4, and 76.8% of the peak flux density (see Table B.1); at 86 GHz, images are restored with a beam of 0.16 × 0.08 mas, 0°, and the contour levels are set to 0.5, 1, 2, 4, 8, 16, 32, and 64% of the peak flux density (see Table B.1). The two beams are displayed on the left and right corners respectively. The time stamp for each image is indicated on the x-axis.
Current usage metrics show cumulative count of Article Views (full-text article views including HTML views, PDF and ePub downloads, according to the available data) and Abstracts Views on Vision4Press platform.
Data correspond to usage on the plateform after 2015. The current usage metrics is available 48-96 hours after online publication and is updated daily on week days.
Initial download of the metrics may take a while.