Fig. 1.
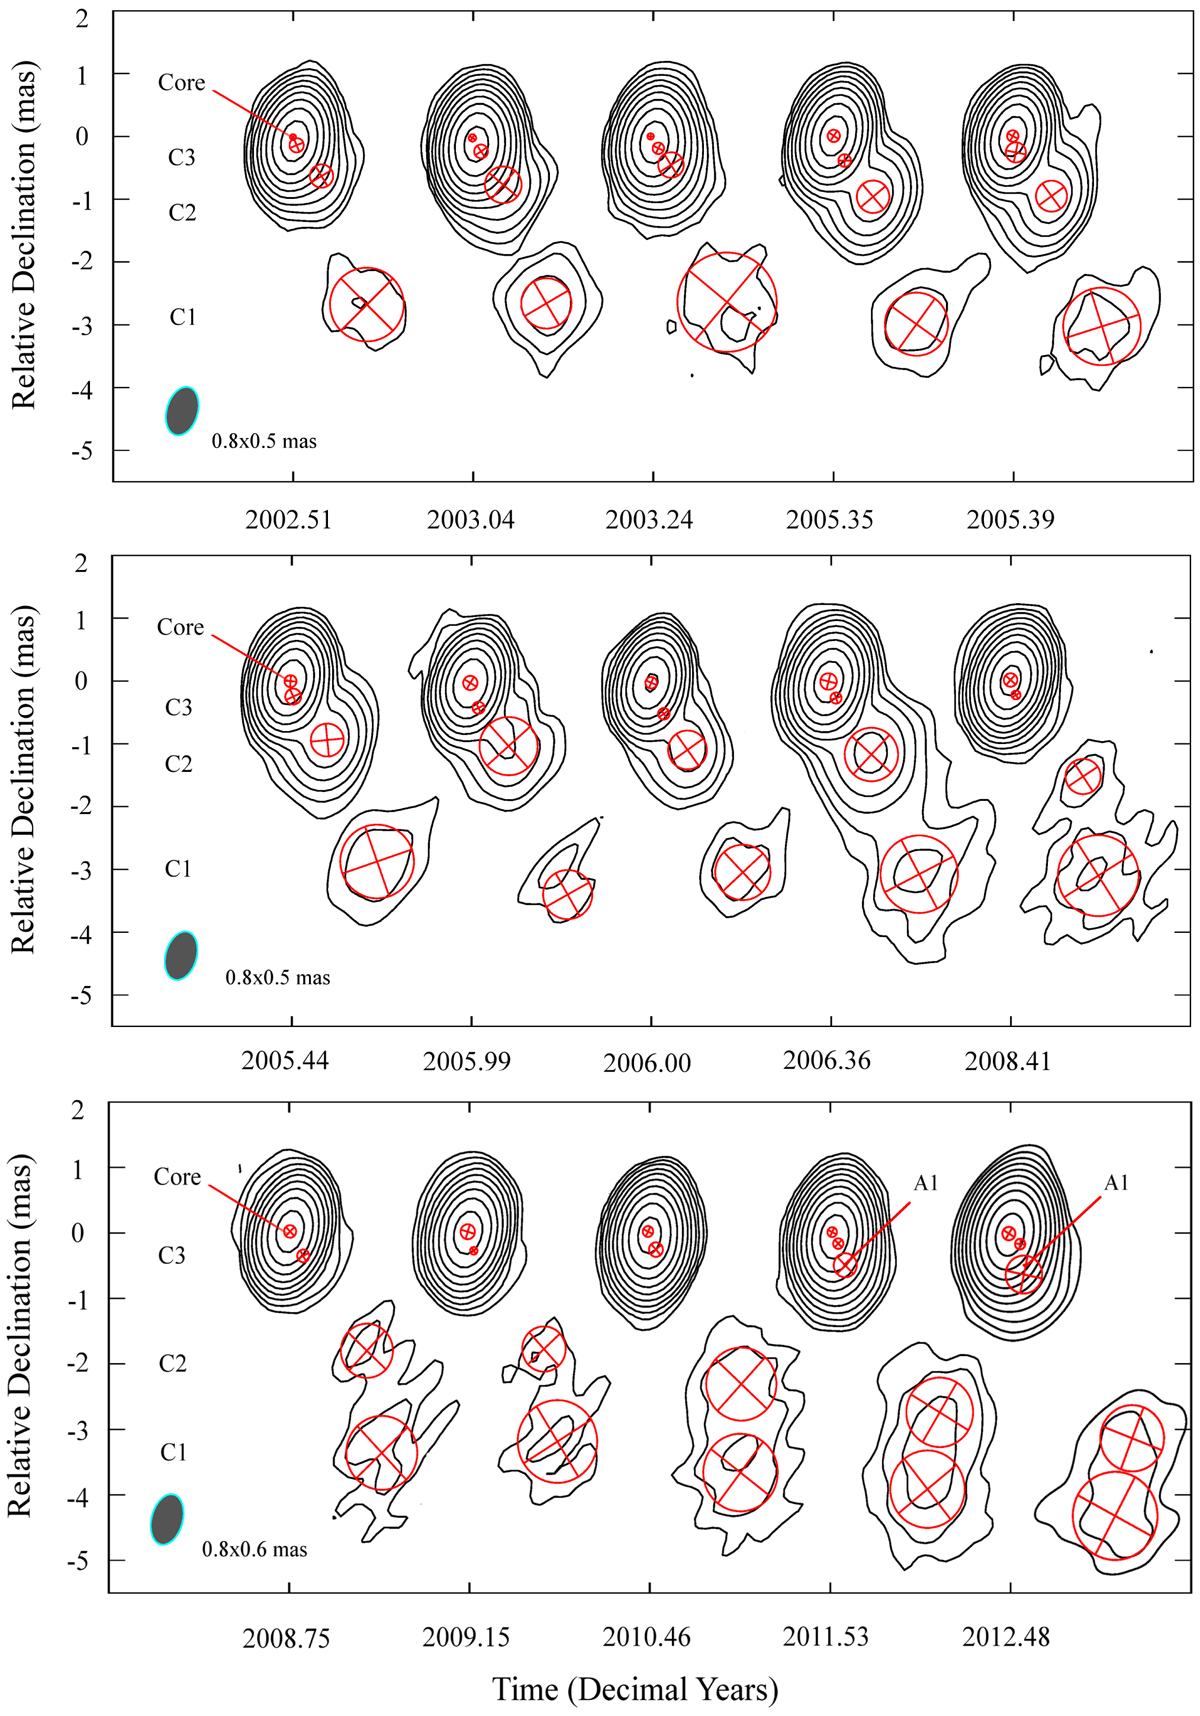
Modeled images of blazar TXS 2013+370 at 15 GHz. The 2 dimensional circular Gaussian components model the flux density distribution along the jet. The data were imaged under a uniform weighting scheme and without uv-tapering (all the visibilities weighed equally, independent of their uv-distance). The contour levels are set to 0.25,0.5, 1, 2, 4, 8, 16, 32, and 64% Jy beam−1 of each image peak flux density (see Table B.1). All the images are convolved with a common beam of 0.8 × 0.5 mas at PA −16°. The time corresponding to each image is indicated in the x-axis.
Current usage metrics show cumulative count of Article Views (full-text article views including HTML views, PDF and ePub downloads, according to the available data) and Abstracts Views on Vision4Press platform.
Data correspond to usage on the plateform after 2015. The current usage metrics is available 48-96 hours after online publication and is updated daily on week days.
Initial download of the metrics may take a while.