Fig. 8
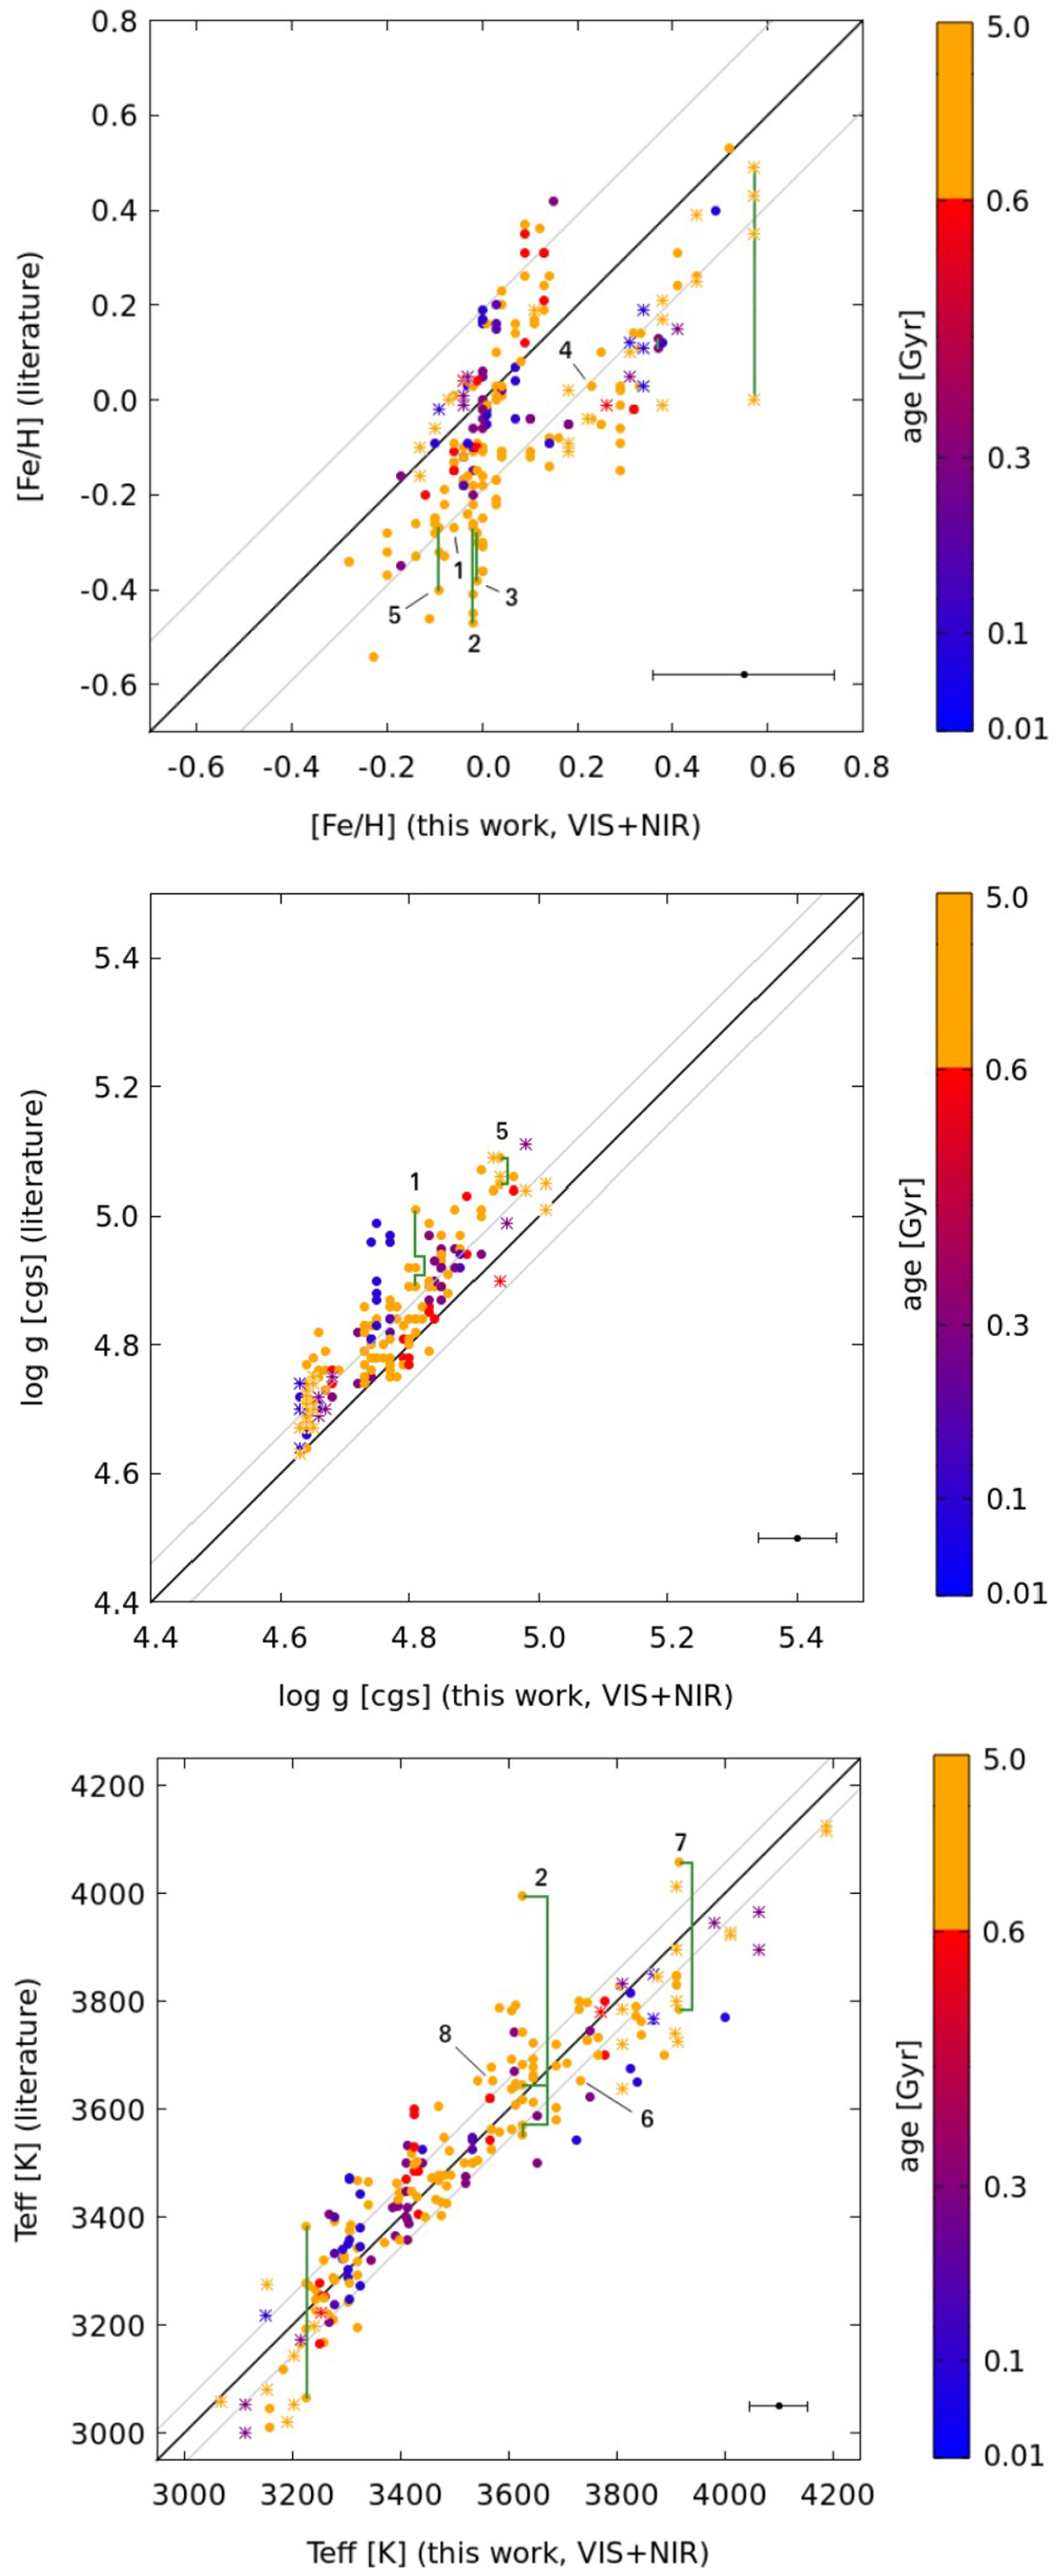
Comparison of [Fe/H] (top panel), log g (middle panel), and Teff (bottom panel) between values of this work in VIS+NIR and literature. The age is color-coded, active star are plotted as asterisks. Outliers are identified with numbers, the green lines connect different literature values for them. The black line indicates the 1:1 relation, the grey lines the 1σ deviation.
Current usage metrics show cumulative count of Article Views (full-text article views including HTML views, PDF and ePub downloads, according to the available data) and Abstracts Views on Vision4Press platform.
Data correspond to usage on the plateform after 2015. The current usage metrics is available 48-96 hours after online publication and is updated daily on week days.
Initial download of the metrics may take a while.