Fig. 8.
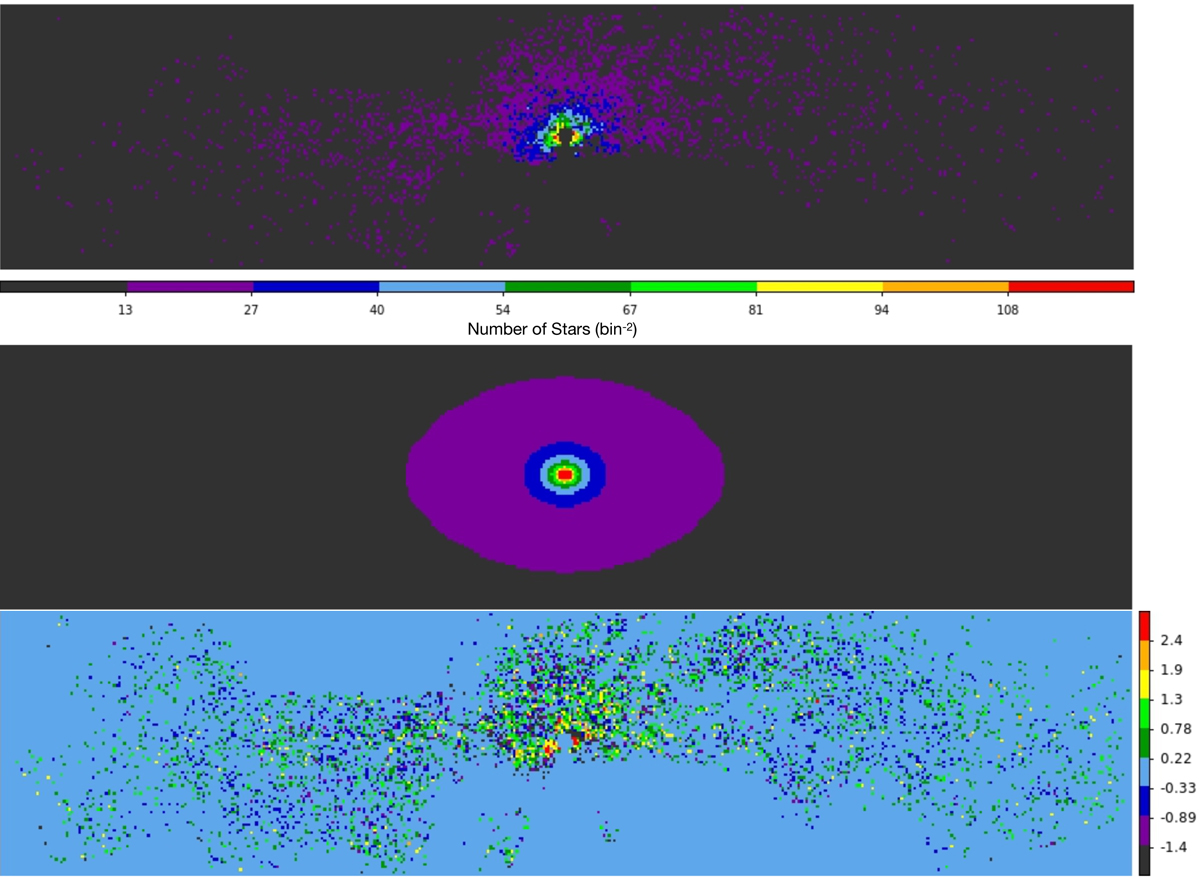
Comparison between the stellar density map of the central 86 pc × 20.2 pc of the Galaxy and the model. Upper: extinction-corrected stellar density map for stars with 9.0 ≤ Ks, extc ≤ 14.0. The dark regions are masked in the fit. Middle: Sérsic model for the NSC plus the background model (ID 10 in Table A.2). Lower: residual image given by the difference between the upper and middle panels divided by the uncertainty map of the density map. The color bar shown for the lower panel is in units of the standard deviation. The other two panels use the same linear color scale. Galactic north is up and Galactic east is to the left.
Current usage metrics show cumulative count of Article Views (full-text article views including HTML views, PDF and ePub downloads, according to the available data) and Abstracts Views on Vision4Press platform.
Data correspond to usage on the plateform after 2015. The current usage metrics is available 48-96 hours after online publication and is updated daily on week days.
Initial download of the metrics may take a while.