Fig. 4.
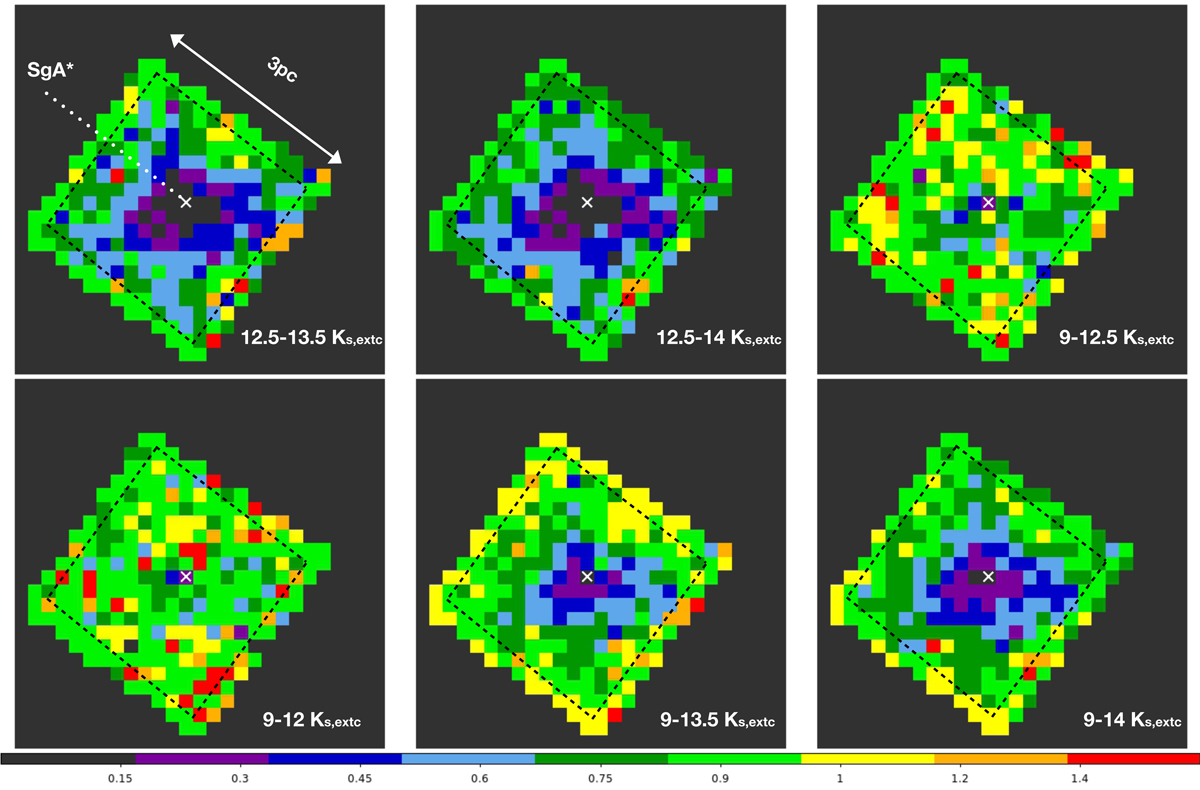
Completeness maps for HAWK-I in the central ∼1.5 pc of the Galaxy by comparing with NACO data. The maps represent the number of stars from HAWK-I data divided by the number of stars from NACO data. The region where only NACO data are used to create the density maps is outlined in the panels by the dashed black square. The outer region is the overlapping region, where we take the mean between both data sets. We can see that the completeness is greater than 88% in the edges in all cases, and therefore we do not apply any scaling factor when we join the data.
Current usage metrics show cumulative count of Article Views (full-text article views including HTML views, PDF and ePub downloads, according to the available data) and Abstracts Views on Vision4Press platform.
Data correspond to usage on the plateform after 2015. The current usage metrics is available 48-96 hours after online publication and is updated daily on week days.
Initial download of the metrics may take a while.