Fig. 15.
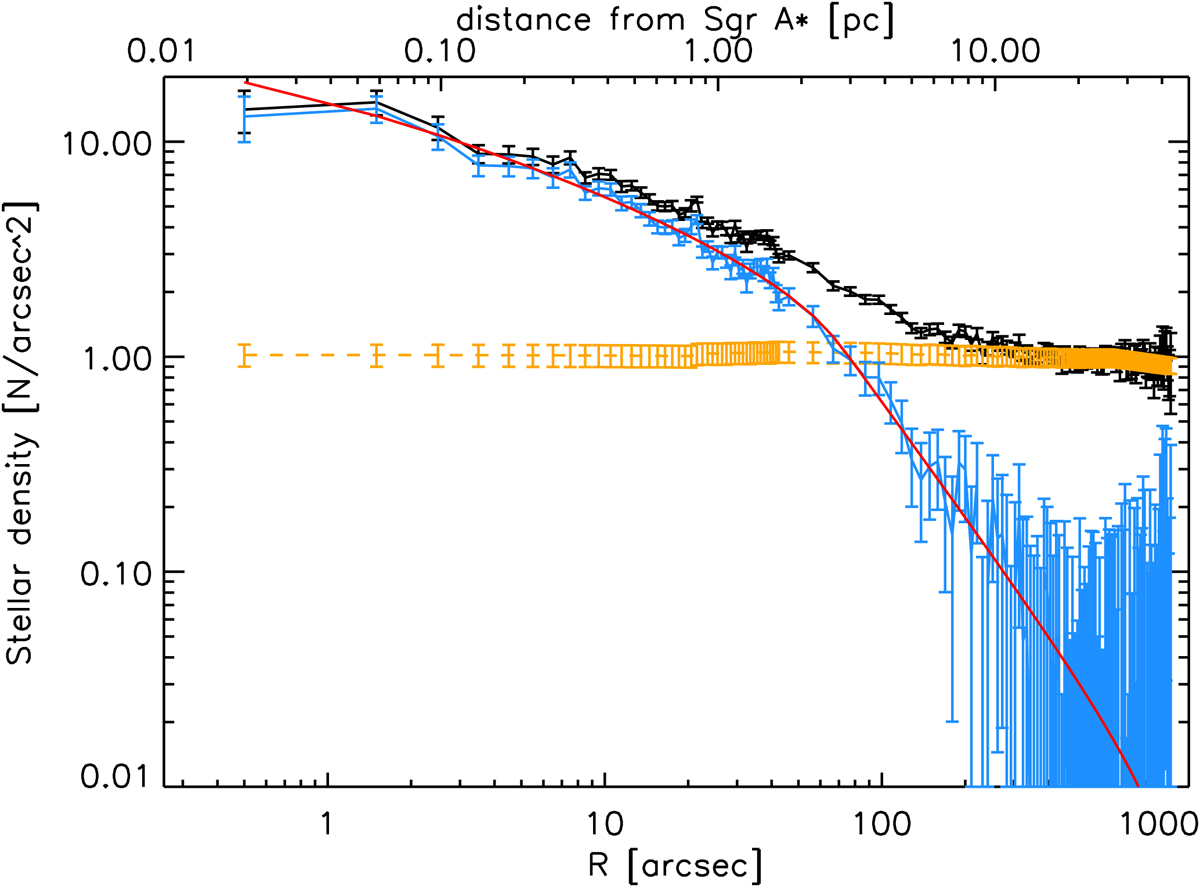
Black: combined, corrected surface density data for stars in the magnitude interval 17.5 ≤ Ks ≤ 18.5 from Gallego-Cano et al. (2018), plus scaled data from the GALACTICNUCLEUS survey at large radii. The blue data points are the data after subtraction of the Model 2 in Table 4 for the emission from the nuclear stellar disk and the Galactic bulge (the dashed orange line). The red line is a Nuker model fit (ID 10 in Table B.1).
Current usage metrics show cumulative count of Article Views (full-text article views including HTML views, PDF and ePub downloads, according to the available data) and Abstracts Views on Vision4Press platform.
Data correspond to usage on the plateform after 2015. The current usage metrics is available 48-96 hours after online publication and is updated daily on week days.
Initial download of the metrics may take a while.