Fig. 14.
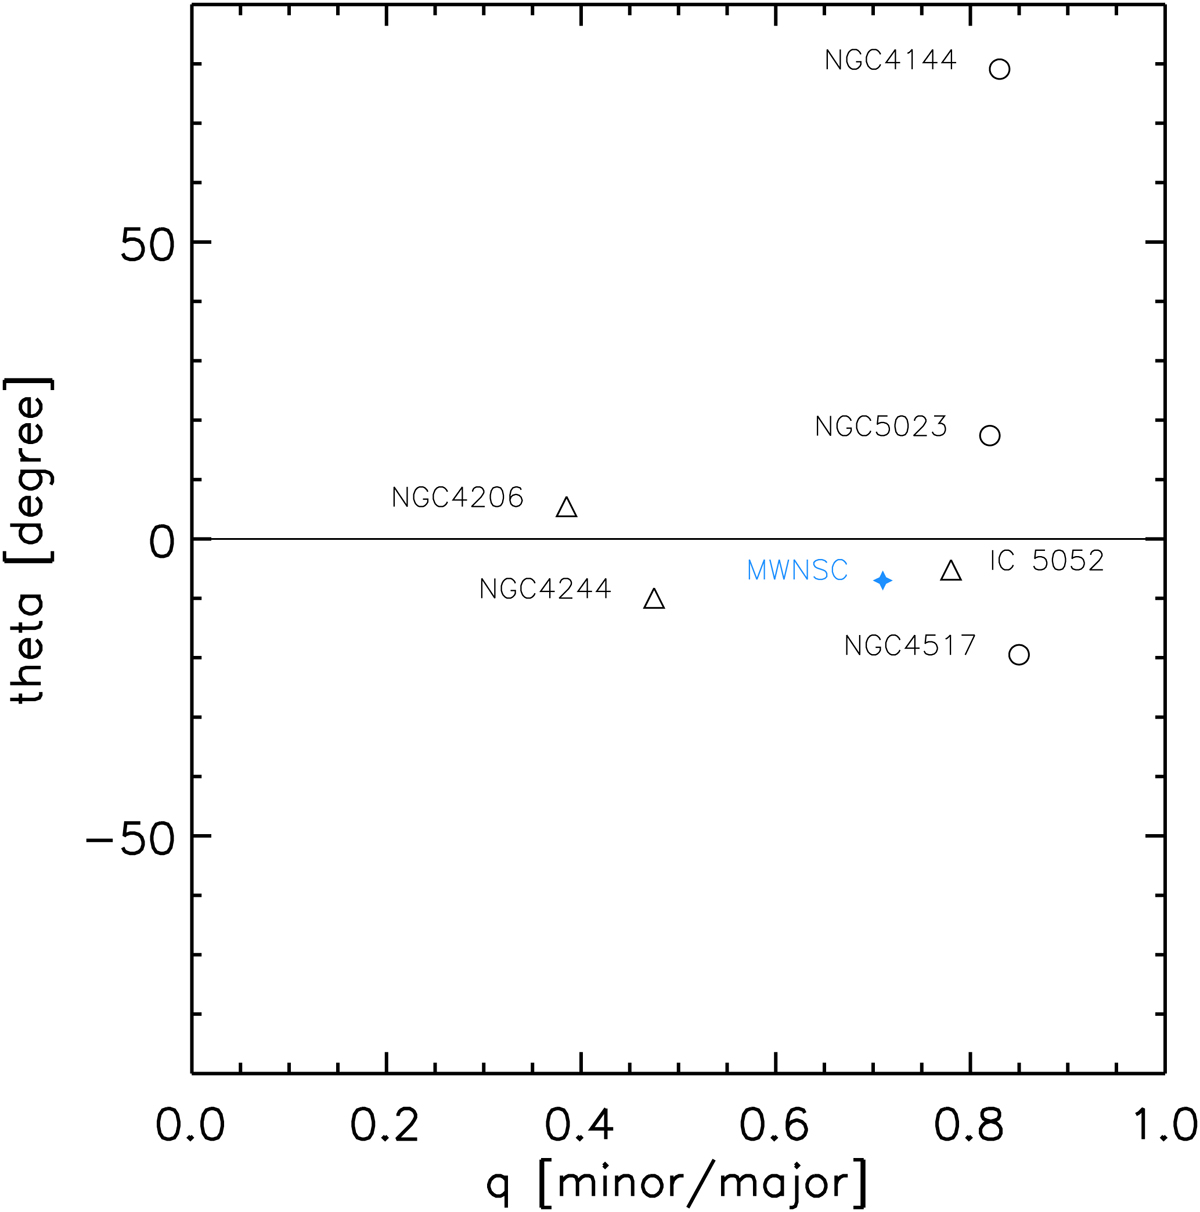
Axis ratio “q” vs. “theta”, the tilt angle between the NSC major axis and the host galaxy plane for different NSCs found in edge-on spiral galaxies (data are from Table 2 in Seth et al. 2006). The data have been averaged for the two different filters for every NSC. The name of the galaxy is indicated in the panel. The three “multicomponent” nuclear clusters are all aligned within −10° of the galactic plane of the host galaxy (triangles), similar to the value of the MWNSC found in the present study (the blue star). All the NSCs are flattened along the plane of the galaxy, similar to what is observed for the MWNSC.
Current usage metrics show cumulative count of Article Views (full-text article views including HTML views, PDF and ePub downloads, according to the available data) and Abstracts Views on Vision4Press platform.
Data correspond to usage on the plateform after 2015. The current usage metrics is available 48-96 hours after online publication and is updated daily on week days.
Initial download of the metrics may take a while.