Fig. 13.
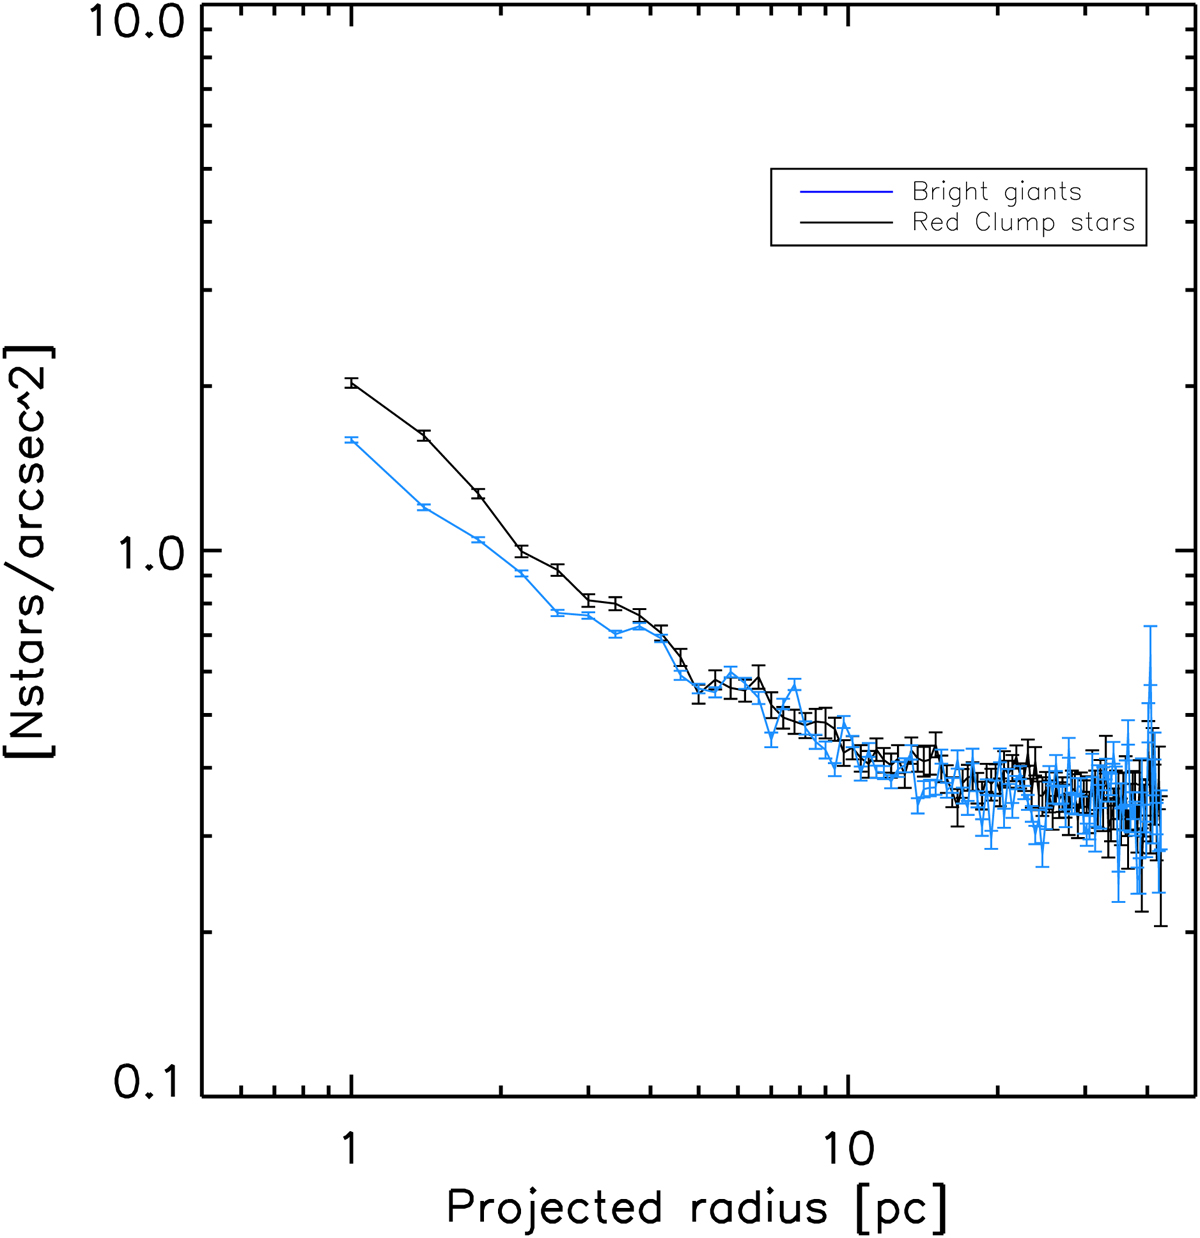
Comparison between the projected radius profiles computed for different ranges of magnitudes along the GP. Only the data closer than 50″ (2 pc) to the GP are taken into account. The black line shows the density profile for RC stars (12.5 ≤ Ks, extc ≤ 14) and the blue line indicates the density profile for bright stars (9.0 ≤ Ks, extc ≤ 12). In order to facilitate the comparison between both profiles, the data for the bright stars are scaled using the median ratio of both number counts at distances larger than 10 pc. We mask the inner 0.6 pc around Sgr A*.
Current usage metrics show cumulative count of Article Views (full-text article views including HTML views, PDF and ePub downloads, according to the available data) and Abstracts Views on Vision4Press platform.
Data correspond to usage on the plateform after 2015. The current usage metrics is available 48-96 hours after online publication and is updated daily on week days.
Initial download of the metrics may take a while.