Fig. A.2.
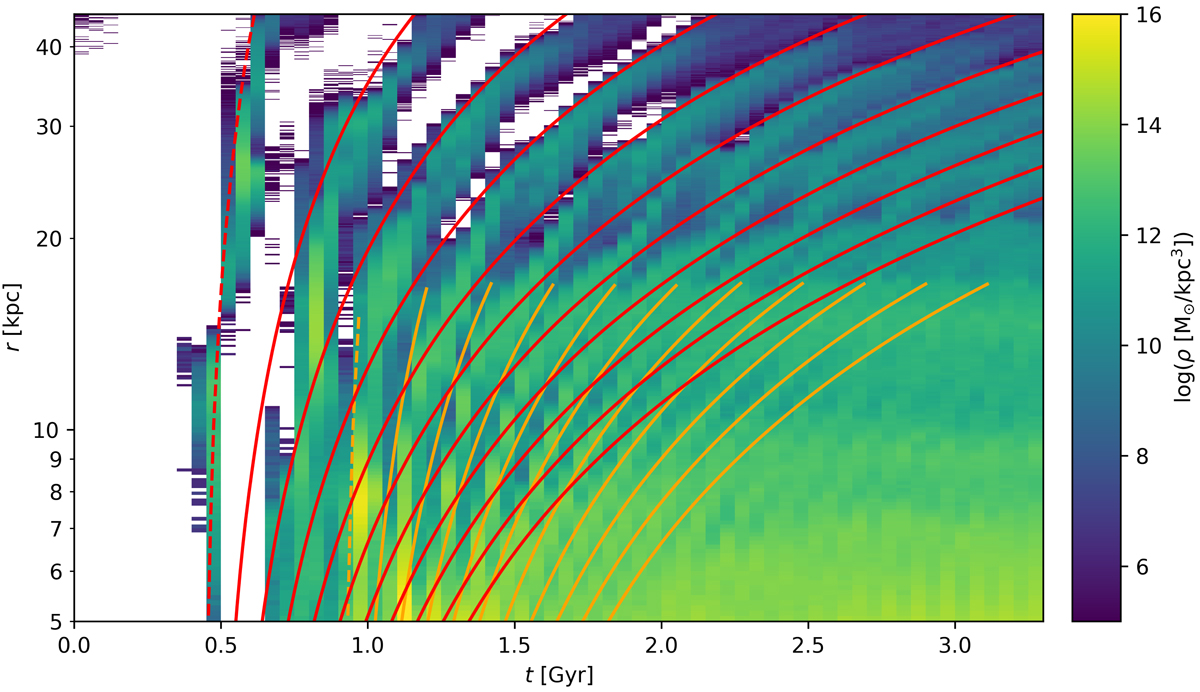
Comparison of shell evolution in the simulation (the density histogram in color scale; shell edges correspond to the areas of the enhanced density) with our model (red and orange curves of the first and third shell generation, respectively; the so-called zeroth shells are marked with dashed curves). Time is measured from the beginning of the simulation, when the relative distance of the galaxies was 70 kpc.
Current usage metrics show cumulative count of Article Views (full-text article views including HTML views, PDF and ePub downloads, according to the available data) and Abstracts Views on Vision4Press platform.
Data correspond to usage on the plateform after 2015. The current usage metrics is available 48-96 hours after online publication and is updated daily on week days.
Initial download of the metrics may take a while.