Fig. 2.
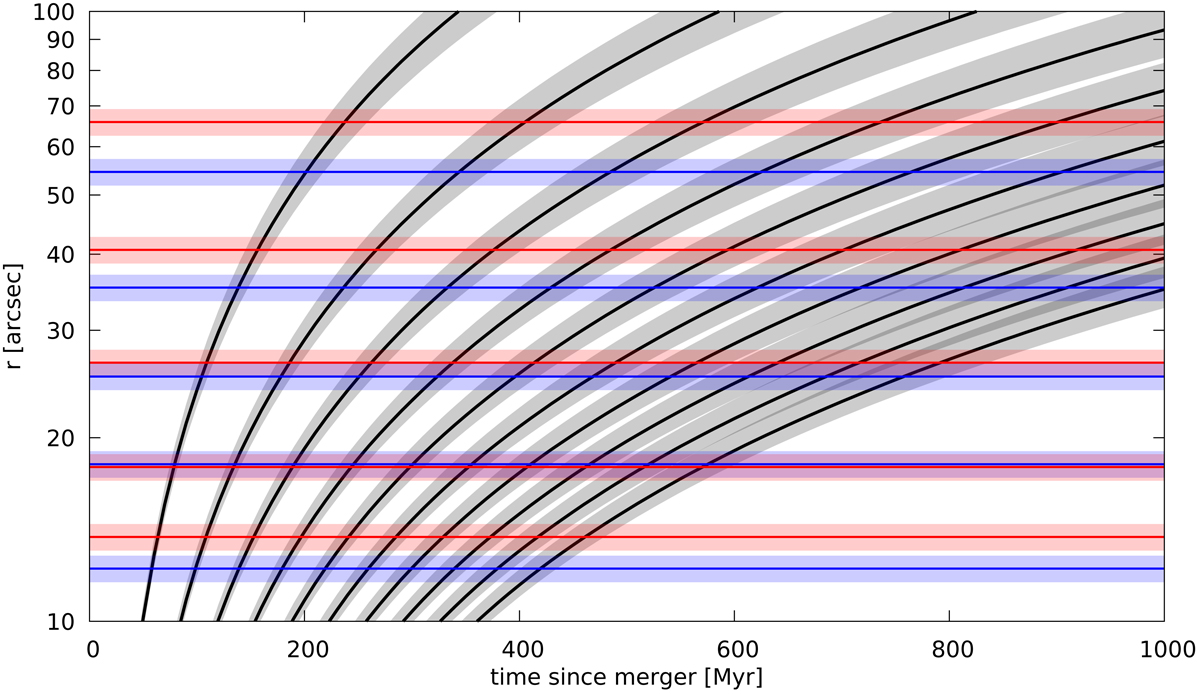
Black curves show the modeled evolution of the radii for the first ten shells in the gravitational potential of NGC 4993. The gray transparent regions correspond to the uncertainties in the halo mass and concentration. Red (blue) lines correspond to the actual shell edges north (south) of the center of NGC 4993. The transparent red and blue stripes correspond to the measurement errors of the shell radii, ±5%, measured on the major axis of the galaxy.
Current usage metrics show cumulative count of Article Views (full-text article views including HTML views, PDF and ePub downloads, according to the available data) and Abstracts Views on Vision4Press platform.
Data correspond to usage on the plateform after 2015. The current usage metrics is available 48-96 hours after online publication and is updated daily on week days.
Initial download of the metrics may take a while.