Fig. 1.
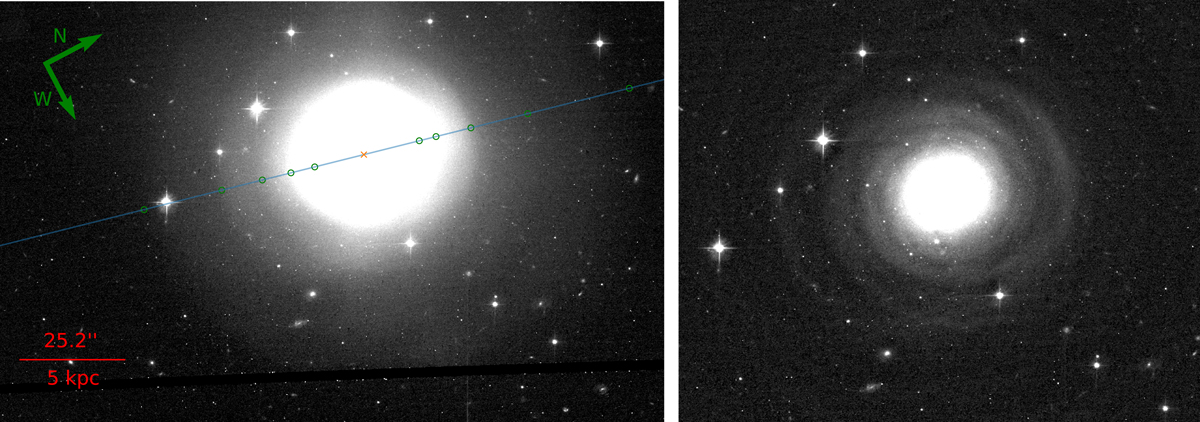
Image of shell galaxy NGC 4993 (based on the HST/ACS data in the F814W filter). Left: image processed by intensity scaling to show the outer shells. The blue line indicates the visually determined major photometric axis. The orange cross denotes the center of the galaxy. The green circles on the blue line mark the positions of the measurements of shell radii (Table 1). Right: image processed by minimum masking technique (Bílek et al. 2016), with the filter size of 1.2″, reveals the shells close to the galaxy center. We note the two-arm spiral-like morphology of the shells.
Current usage metrics show cumulative count of Article Views (full-text article views including HTML views, PDF and ePub downloads, according to the available data) and Abstracts Views on Vision4Press platform.
Data correspond to usage on the plateform after 2015. The current usage metrics is available 48-96 hours after online publication and is updated daily on week days.
Initial download of the metrics may take a while.