Open Access
Fig. 8.
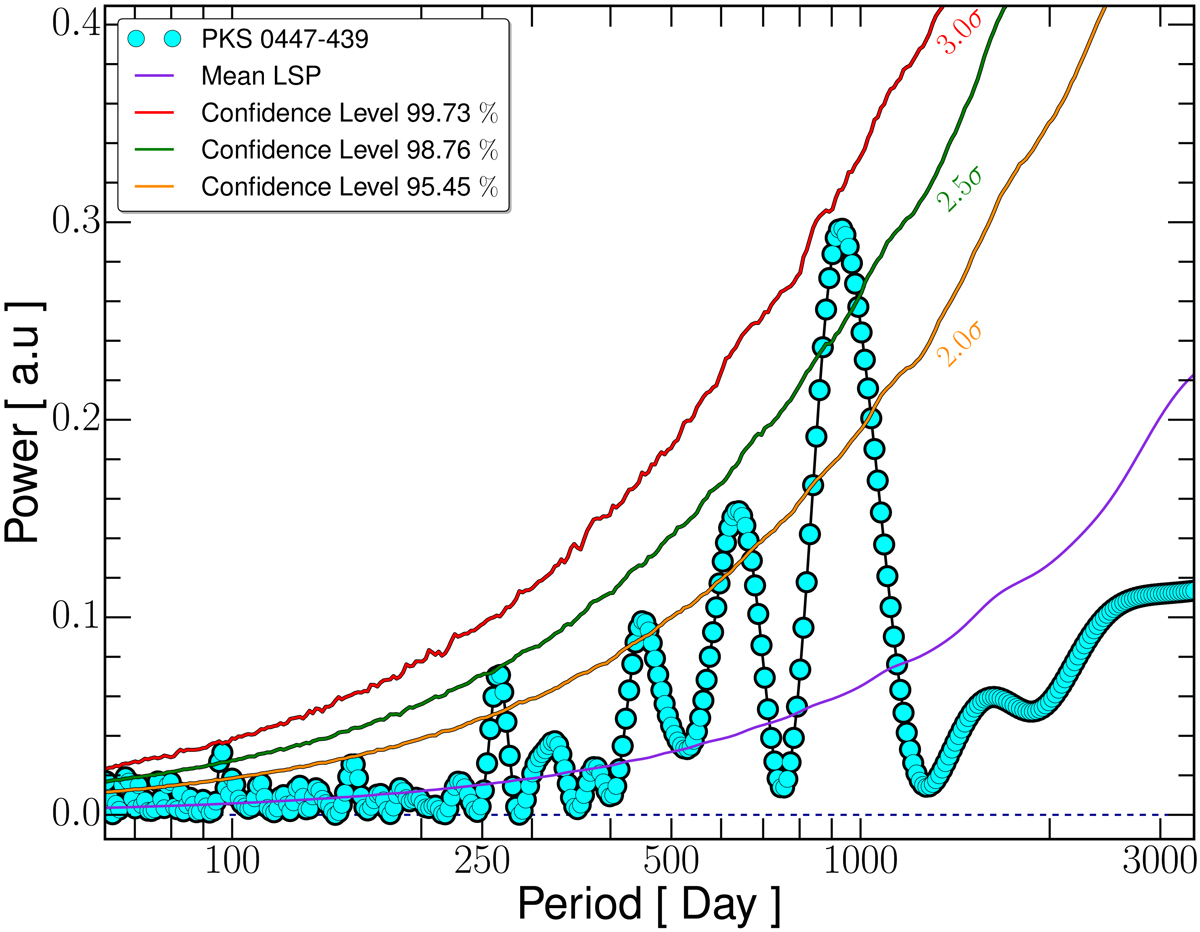
GLPS obtained using the monthly light curves of PKS 0447−439 is shown in cyan (circles); the red solid line, green line, and orange line represent the 3σ, 2.5σ, and 2σ confidence levels, respectively, calculated based on simulations of 50 000 light curves using the method of Timmer & Koenig (1995).
Current usage metrics show cumulative count of Article Views (full-text article views including HTML views, PDF and ePub downloads, according to the available data) and Abstracts Views on Vision4Press platform.
Data correspond to usage on the plateform after 2015. The current usage metrics is available 48-96 hours after online publication and is updated daily on week days.
Initial download of the metrics may take a while.