Fig. 6.
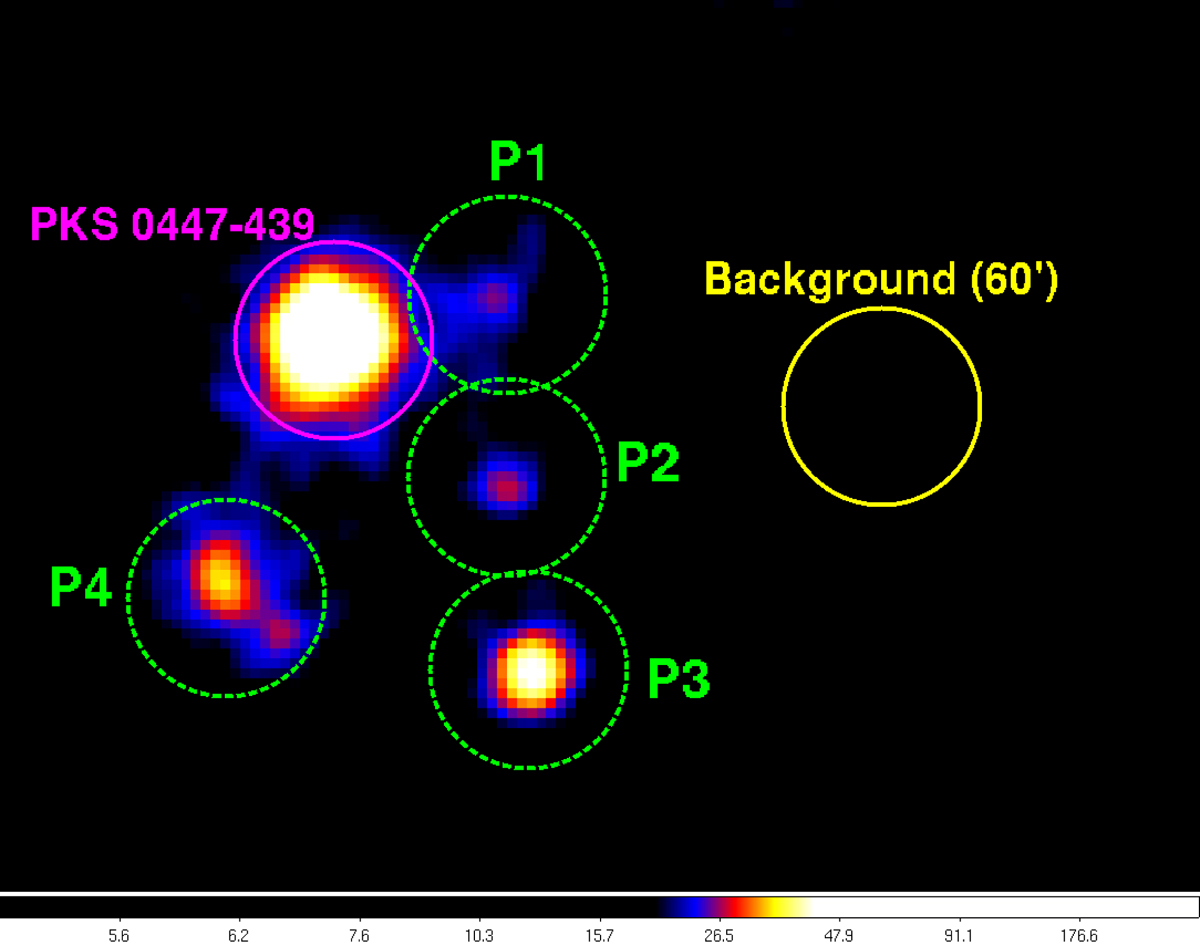
Smoothed count map (logarithmic scale) of the PKS 0447−439 region in energy range from 100 MeV up to 500 GeV as seen by Fermi-LAT based on data between August 2008 and December 2017. The color bar has units of counts per pixel and the pixel dimensions are 0.1 × 0.1°. The locations of the background region and surrounding sources (labeled P1 = new source beyond the 3FGL catalog, P2 = 3FGL J0438.8−4519, P3 = 3FGL J0437.2−4713 and P4 = 3FGL J0455.7−4617) are shown as circles. The magenta circle shows the location of PKS 0447−439 and the yellow circles represent the background region.
Current usage metrics show cumulative count of Article Views (full-text article views including HTML views, PDF and ePub downloads, according to the available data) and Abstracts Views on Vision4Press platform.
Data correspond to usage on the plateform after 2015. The current usage metrics is available 48-96 hours after online publication and is updated daily on week days.
Initial download of the metrics may take a while.