Fig. 4.
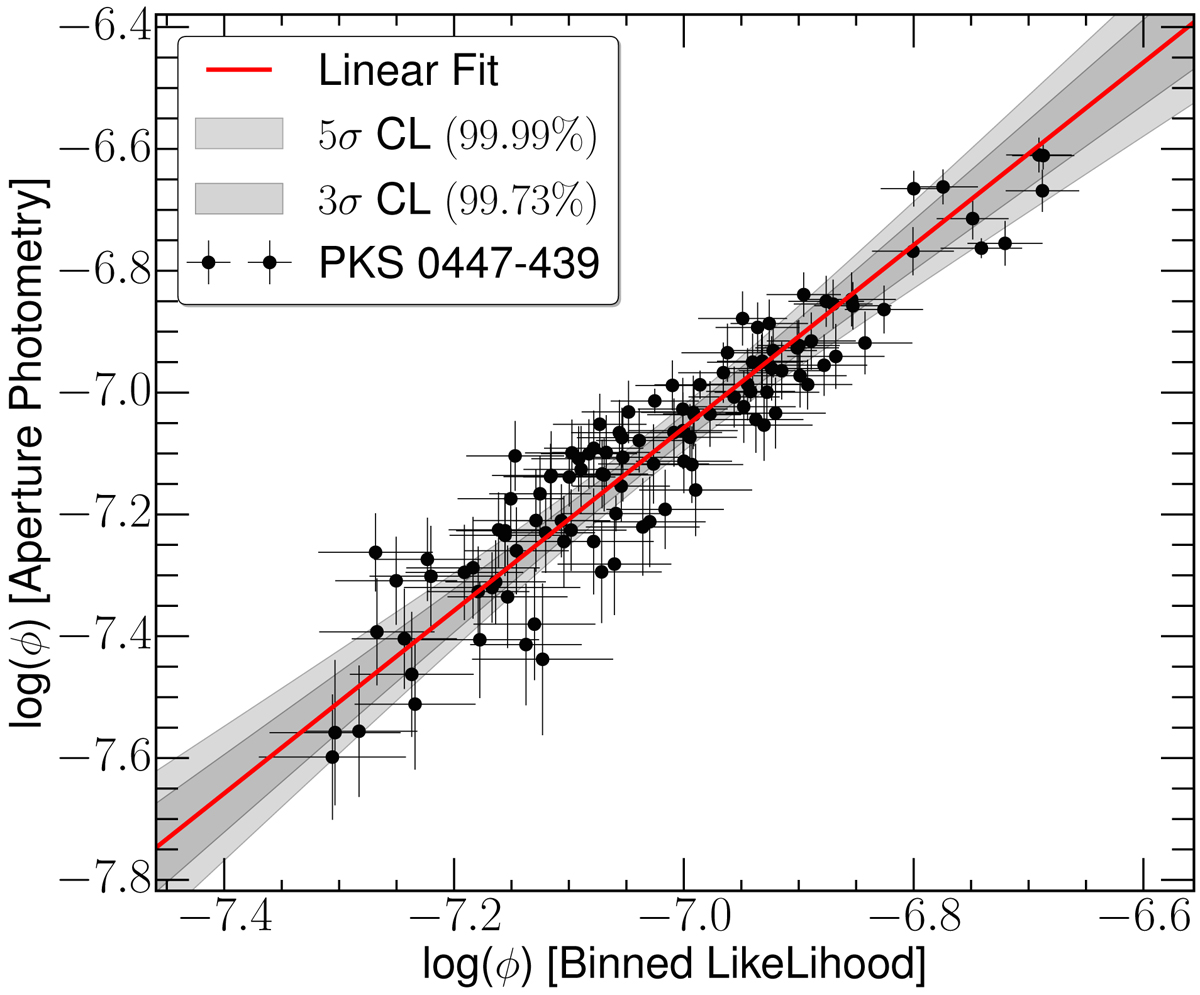
Aperture photometry flux in comparison with the binned likelihood flux calculated for PKS 0447−439 (logarithmic scale). The red solid line represents a fit of the data with a linear function and the gray shaded regions show the resulting 3σ and 5σ confidence intervals. Error bars indicate the 1σ error interval. No background subtraction is used in the aperture photometry method.
Current usage metrics show cumulative count of Article Views (full-text article views including HTML views, PDF and ePub downloads, according to the available data) and Abstracts Views on Vision4Press platform.
Data correspond to usage on the plateform after 2015. The current usage metrics is available 48-96 hours after online publication and is updated daily on week days.
Initial download of the metrics may take a while.