Fig. 2.
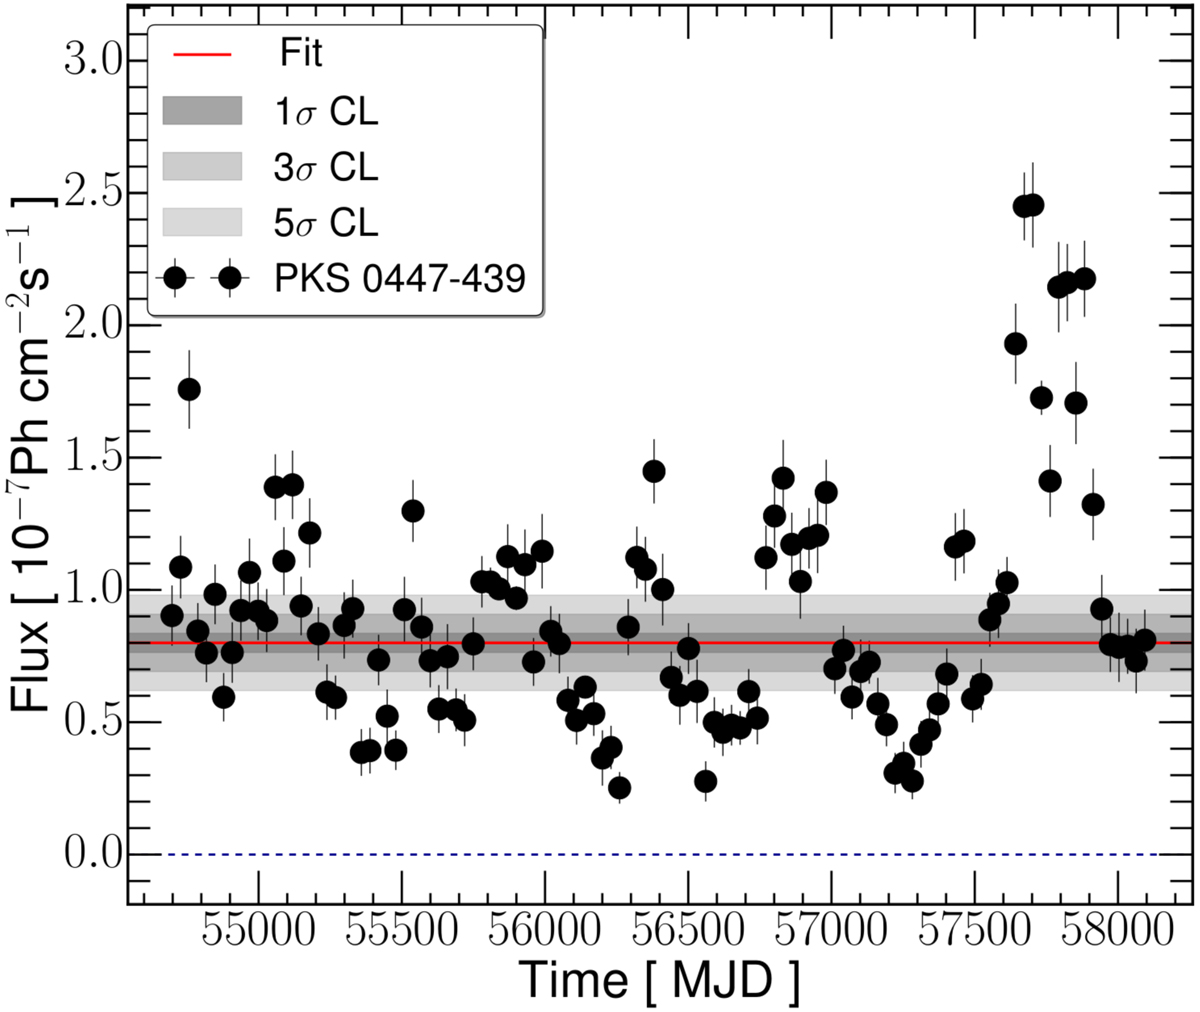
γ-ray light curve of PKS 0447−439 from August 2008 to December 2017 in the energy range between 100 MeV and 500 GeV in intervals of 30 days. The dotted line gives a fit with a constant flux. There is clear evidence for variability. Vertical error bars indicate the one-sigma error bars. The gray shaded regions show the 1σ, 3σ, and 5σ confidence intervals resulting from the fit with a constant function.
Current usage metrics show cumulative count of Article Views (full-text article views including HTML views, PDF and ePub downloads, according to the available data) and Abstracts Views on Vision4Press platform.
Data correspond to usage on the plateform after 2015. The current usage metrics is available 48-96 hours after online publication and is updated daily on week days.
Initial download of the metrics may take a while.