Fig. 5.
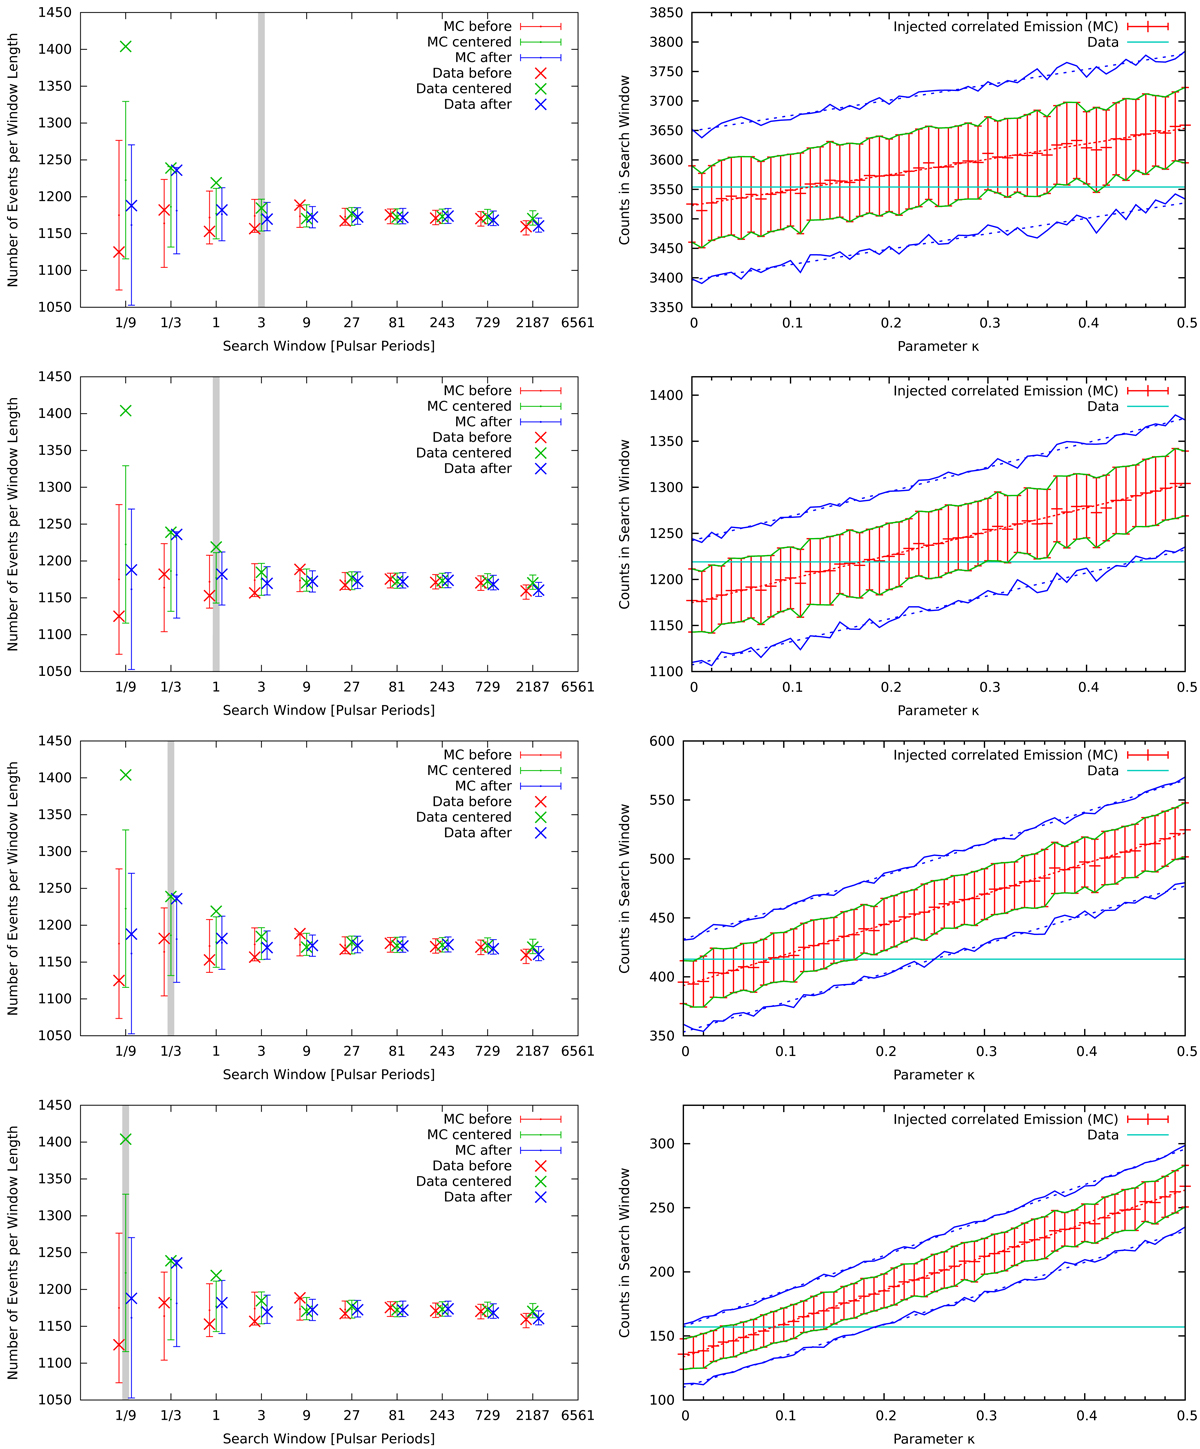
From top to bottom: search windows of 3, 1, 1/3 and 1/9 Crab pulsar rotation periods length. Left: enhancements of VHE γ-rays before, centered on and after a radio GP. The gray bar indicates the search window for which the κ dependence is studied in the respective right hand plot. Right: horizontal cyan line indicates the number of VHE γ-rays in the search window centered on GPs (the corresponding value from the observed data is indicated by a cross in the left hand plot. The normalization of the y-axis between the two columns is different). The plot also contains the results from 50 different sets of γ-ray MC simulations, using different values of κ. The average of each set is indicated by a red tick. The 1σ range is indicated by the green lines, the 1.96σ range (corresponding to a rejection of the null hypothesis on a p = 0.05 confidence level) is indicated by the blue lines.
Current usage metrics show cumulative count of Article Views (full-text article views including HTML views, PDF and ePub downloads, according to the available data) and Abstracts Views on Vision4Press platform.
Data correspond to usage on the plateform after 2015. The current usage metrics is available 48-96 hours after online publication and is updated daily on week days.
Initial download of the metrics may take a while.