Fig. 4.
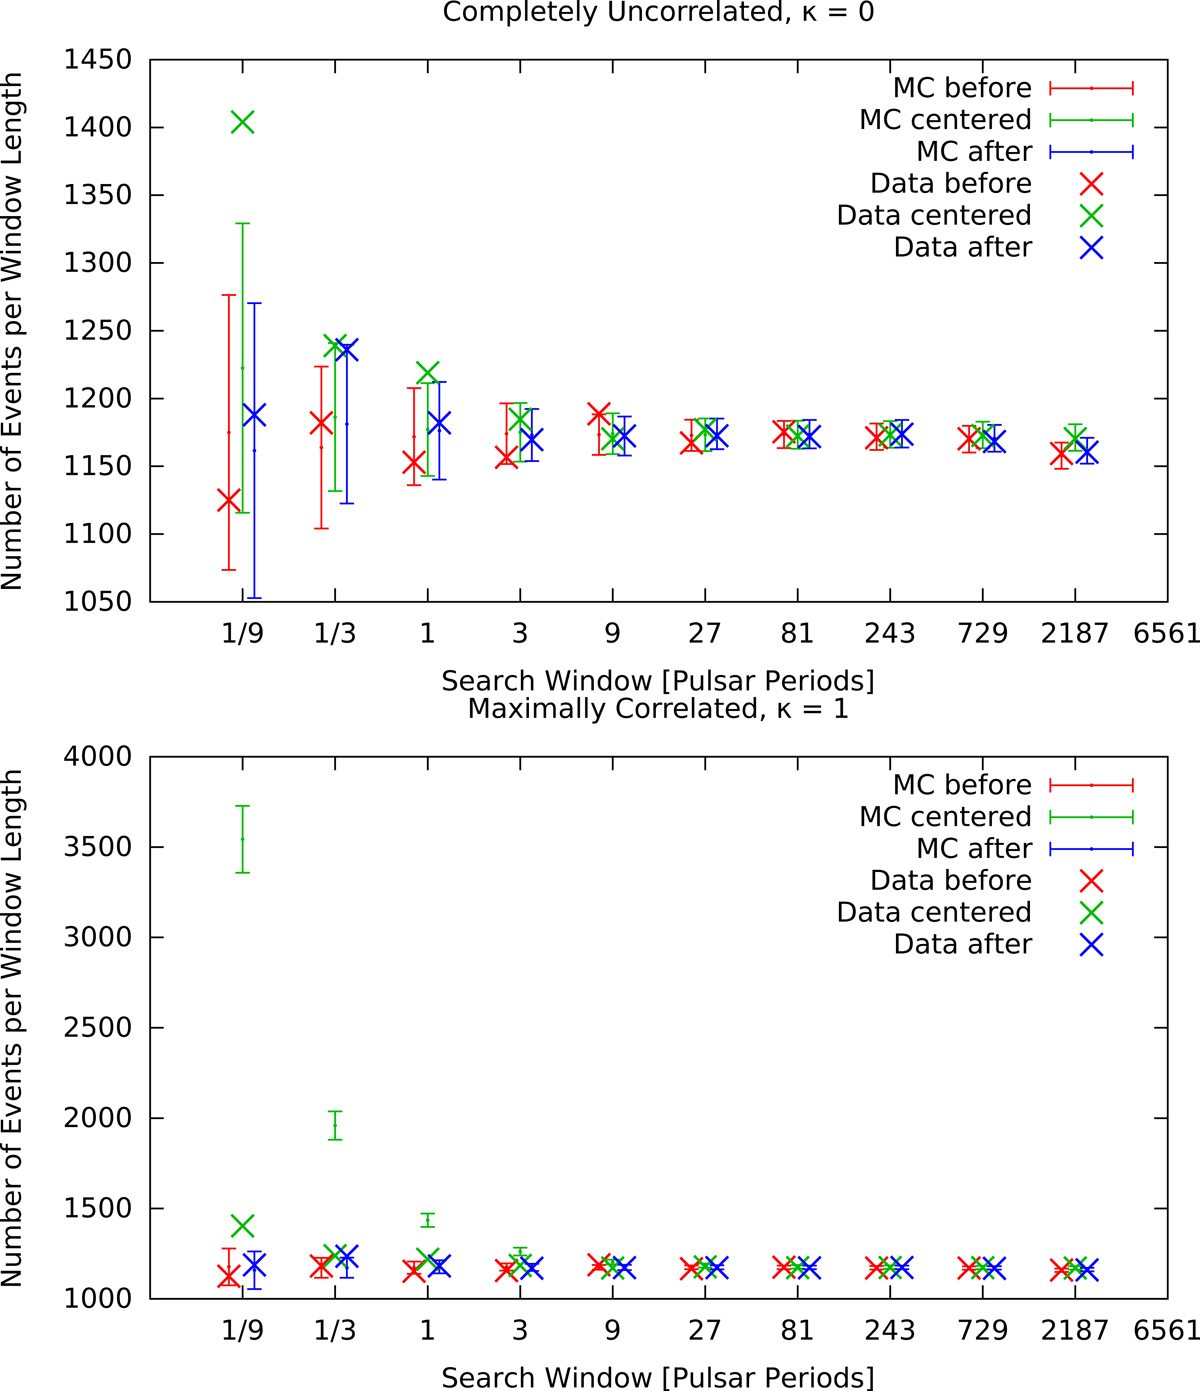
Enhancement of VHE photons around occurring radio GPs resulting out of data sets (marked with crosses) and VHE γ-ray MC simulations (indicated by bars). Upper plot: results for a perfectly uncorrelated VHE γ-ray signal in the MC simulations (κ = 0), while lower plot: flux enhancement results for an injected VHE γ-ray signal which is perfectly correlated with GPs resulting from the radio data in a centered search window (κ = 1). The latter plot shows more clearly an increase of the number of VHE γ-rays centered on radio GPs for shorter search windows resulting from the data sets, indicating that the correlation is located at κ < 1.
Current usage metrics show cumulative count of Article Views (full-text article views including HTML views, PDF and ePub downloads, according to the available data) and Abstracts Views on Vision4Press platform.
Data correspond to usage on the plateform after 2015. The current usage metrics is available 48-96 hours after online publication and is updated daily on week days.
Initial download of the metrics may take a while.