Fig. 2
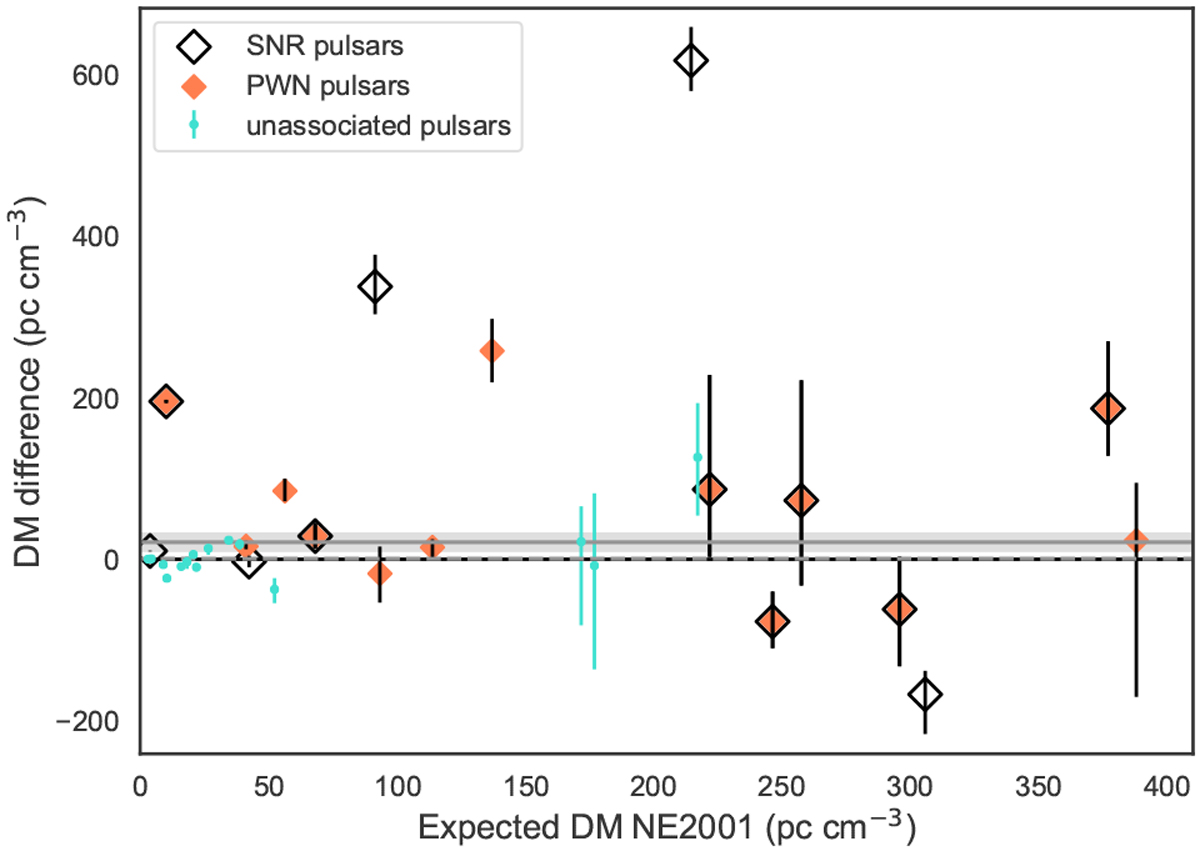
DM difference between measured and predicted, as a function of the NE2001 predicted DM. Associated pulsars are given in diamonds, where open, black diamonds are SNR associations, filled orange diamonds represent PWN associations and black lined diamonds with filled centres are plerionic systems. The pulsars unassociated with a SNR or PWN are shown in turquoise. The offset DM for the associated sample is represented by the grey, solid line with its one σ error-region shaded. The fit, and the one σ error-region, to the offset for the unassociated sample is shown as the grey dashed line and overlaps with the black solid x-axis.
Current usage metrics show cumulative count of Article Views (full-text article views including HTML views, PDF and ePub downloads, according to the available data) and Abstracts Views on Vision4Press platform.
Data correspond to usage on the plateform after 2015. The current usage metrics is available 48-96 hours after online publication and is updated daily on week days.
Initial download of the metrics may take a while.