Fig. 3.
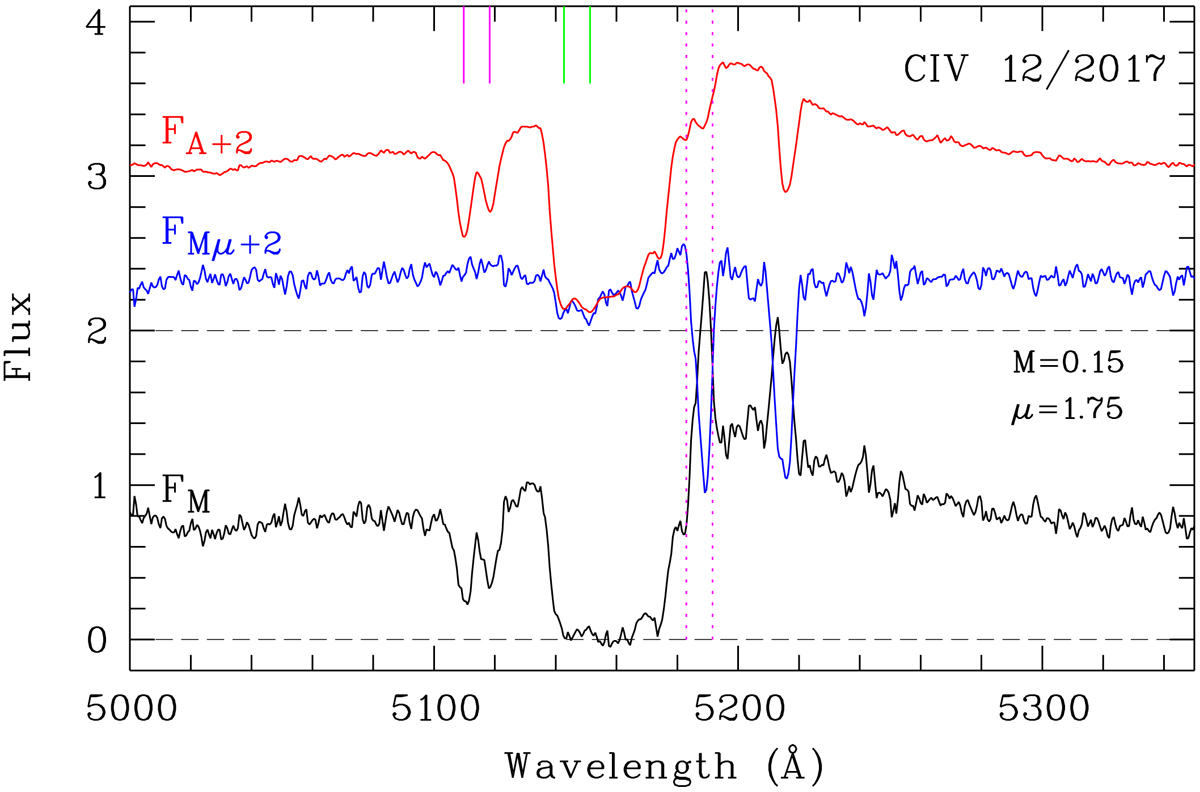
MmD disentangling of the C IV line profile using the spectra of images A and B of the lensed quasar J0818+0601 secured in December 2017 with the VLT. FM is the part of the spectrum not affected by microlensing. FMμ is the part of the spectrum that is micromagnified. FA = FM + FMμ is the spectrum of image A. These spectra are given in arbitray units. FMμ and FA are shifted upward by two units to enhance visibility. M is the macromagnification factor of image B relative to image A. μ is the microlensing magnification factor. The vertical dotted lines indicate the position of the C IV emission doublet for the systemic redshift z = 2.349. The positions of the intrinsic absorption lines are indicated as in Fig. 1
Current usage metrics show cumulative count of Article Views (full-text article views including HTML views, PDF and ePub downloads, according to the available data) and Abstracts Views on Vision4Press platform.
Data correspond to usage on the plateform after 2015. The current usage metrics is available 48-96 hours after online publication and is updated daily on week days.
Initial download of the metrics may take a while.