Fig. 2.
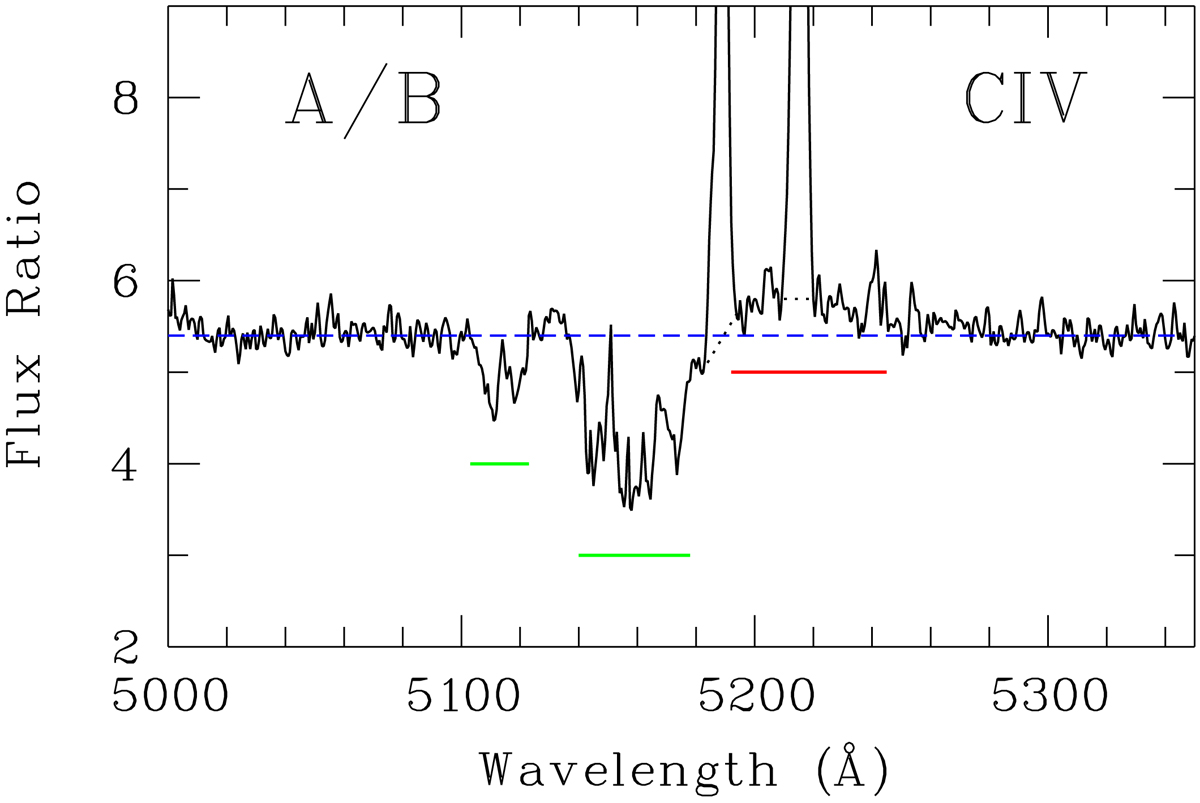
A/B flux density ratio focused on the C IV spectral region. The blue dashed line represents the adjacent, unabsorbed, continuum ratio. The red line underlines the BEL ratio (interpolated with black dots when contaminated by intervening absorptions), which is significantly higher than the unabsorbed continuum ratio. The green lines underline the flux ratio in the intrinsic absorption lines, which appears significantly lower than the unabsorbed continuum ratio.
Current usage metrics show cumulative count of Article Views (full-text article views including HTML views, PDF and ePub downloads, according to the available data) and Abstracts Views on Vision4Press platform.
Data correspond to usage on the plateform after 2015. The current usage metrics is available 48-96 hours after online publication and is updated daily on week days.
Initial download of the metrics may take a while.