Fig. 1.
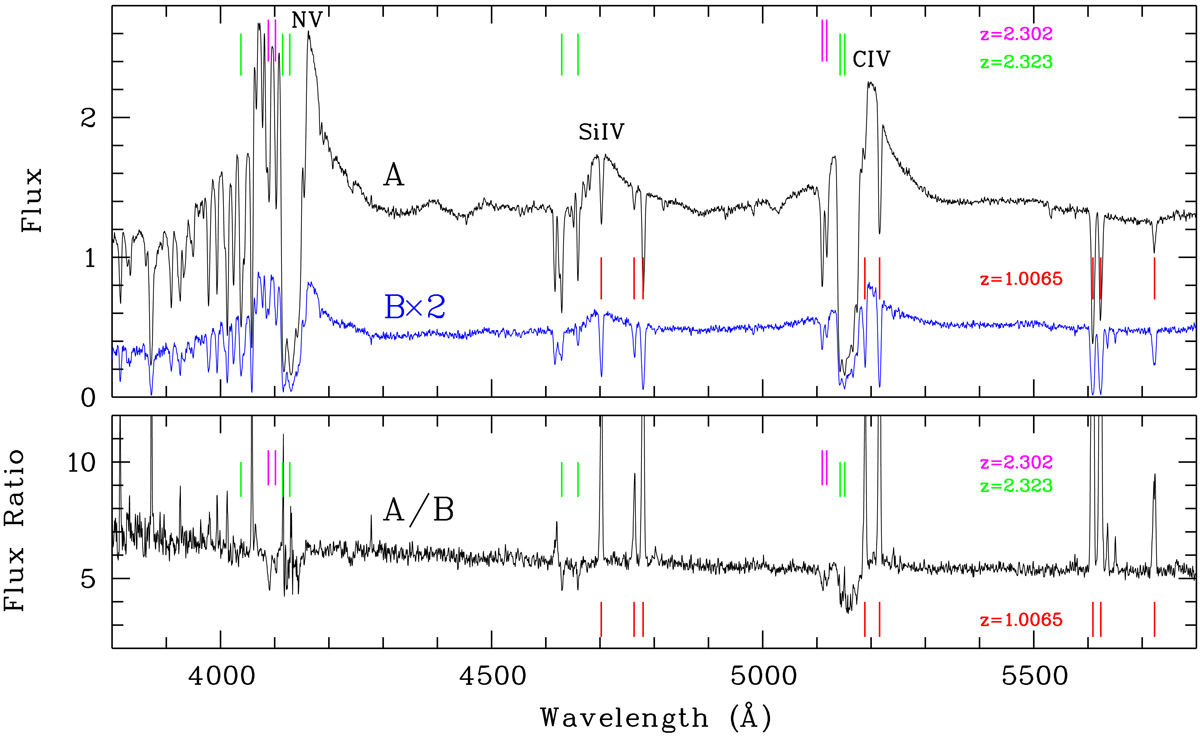
Upper panel: spectra of images A (top) and B (bottom) of J0818+0601. To enhance visibility, the spectra have been divided by an approximate continuum identical for images A and B, and the spectrum of image B has been multiplied by a factor 2. The spectra are given in arbitrary units. Green and magenta tick marks on the top indicate intrinsic absorption features at redshift z = 2.323 (C IVλλ1548.203,1550.777; Si IVλλ1393.755,1402.770; N Vλλ1238.821,1242.804; Lyαλ 1215.670) and z = 2.302 (C IV; N V), respectively. Red tick marks in the middle indicate intervening absorption lines at redshift z = 1.0065 identified in both images A and B (Table 1). Lower panel: A/B flux density ratio. Tick marks indicate the same features as in the upper panel.
Current usage metrics show cumulative count of Article Views (full-text article views including HTML views, PDF and ePub downloads, according to the available data) and Abstracts Views on Vision4Press platform.
Data correspond to usage on the plateform after 2015. The current usage metrics is available 48-96 hours after online publication and is updated daily on week days.
Initial download of the metrics may take a while.