Fig. 2.
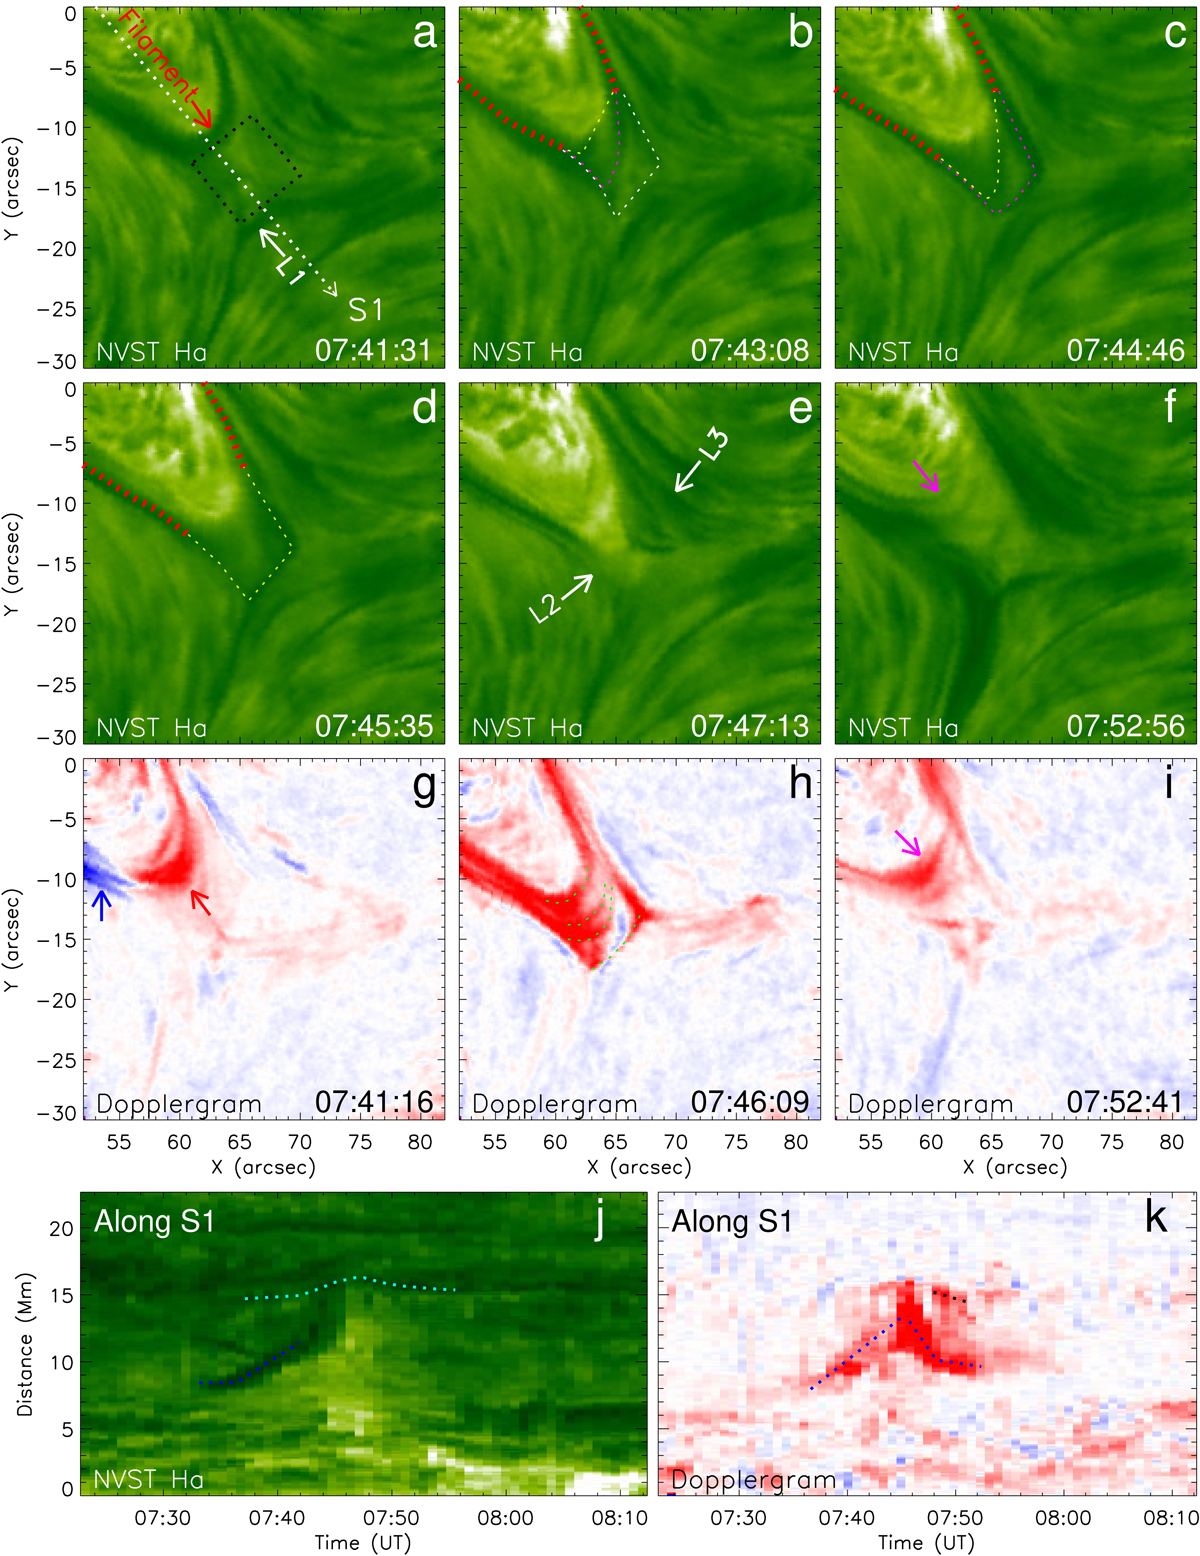
Evolution of magnetic reconnection in the NVST Hα center images (panels a–f) and Dopplergrams (panels g–i). The filament and the magnetic loops (L1) that reconnect in the small region marked by the black rectangle are indicated by the red and white arrows in panel a, respectively. The red, white, pink, yellow and green dotted lines represent the main body and the typical threads of the filament, respectively. The redshifted, blueshifted, and fallback parts of the filament are indicated by the red, blue and pink arrows in panels f, g, and i. The white arrows in panel e point to the newly formed loops (L2 and L3). Panels j and k: the time-distance diagrams obtained along the white dotted line (S1) in panel a using the Hα line-center images and Dopplergrams. The blue, black, and cyan dotted lines mark the motions of the filament and L1. A movie associated to this figure is available online.
Current usage metrics show cumulative count of Article Views (full-text article views including HTML views, PDF and ePub downloads, according to the available data) and Abstracts Views on Vision4Press platform.
Data correspond to usage on the plateform after 2015. The current usage metrics is available 48-96 hours after online publication and is updated daily on week days.
Initial download of the metrics may take a while.