Open Access
Fig. 6.
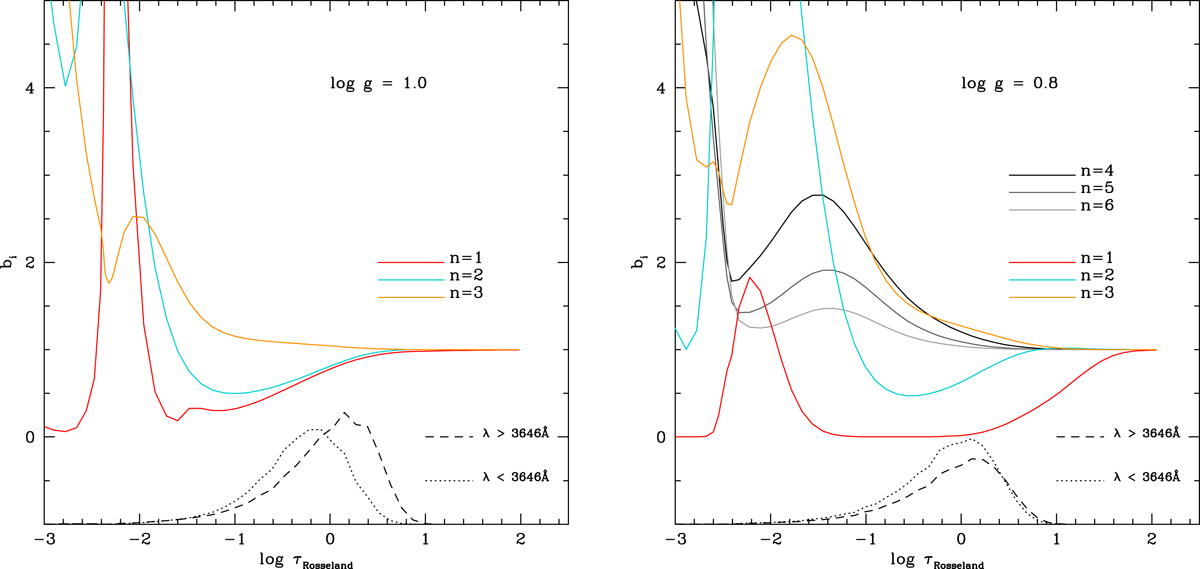
Departure coefficients of levels 1, 2 and 3 in models with Teff = 10 000 K, ![]() = 8.0 and log g = 0.8 (right) and 1.0 (left) as a function of Rosseland optical depth. The dotted and dashed black lines show the contribution functions of the continuum blueward and redward of the Balmer jump, respectively.
= 8.0 and log g = 0.8 (right) and 1.0 (left) as a function of Rosseland optical depth. The dotted and dashed black lines show the contribution functions of the continuum blueward and redward of the Balmer jump, respectively.
Current usage metrics show cumulative count of Article Views (full-text article views including HTML views, PDF and ePub downloads, according to the available data) and Abstracts Views on Vision4Press platform.
Data correspond to usage on the plateform after 2015. The current usage metrics is available 48-96 hours after online publication and is updated daily on week days.
Initial download of the metrics may take a while.