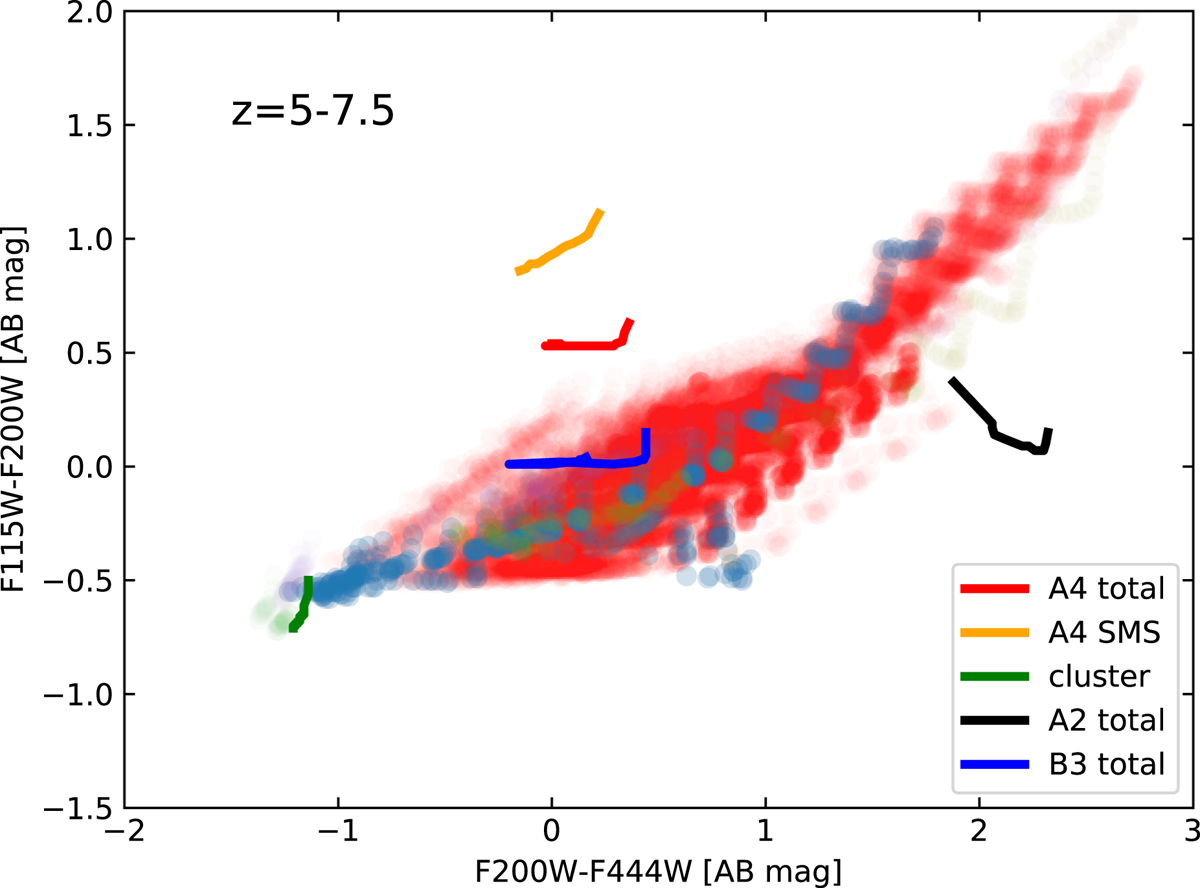
Fig. 15.

Synthetic (F115-F200W) vs. (F200W-F444W) color-color plot for the three proto-GC+SMS models (colored lines, same models as in Fig. 14) at redshift z = 5 − 7.5. The underlying colored cloud shows the location of normal SSPs and integrated populations with exponentially decreasing star formation. The simulations also allow for reddening with AV up to 1, which introduces an additional dispersion along the diagonal in the diagram.
Current usage metrics show cumulative count of Article Views (full-text article views including HTML views, PDF and ePub downloads, according to the available data) and Abstracts Views on Vision4Press platform.
Data correspond to usage on the plateform after 2015. The current usage metrics is available 48-96 hours after online publication and is updated daily on week days.
Initial download of the metrics may take a while.


