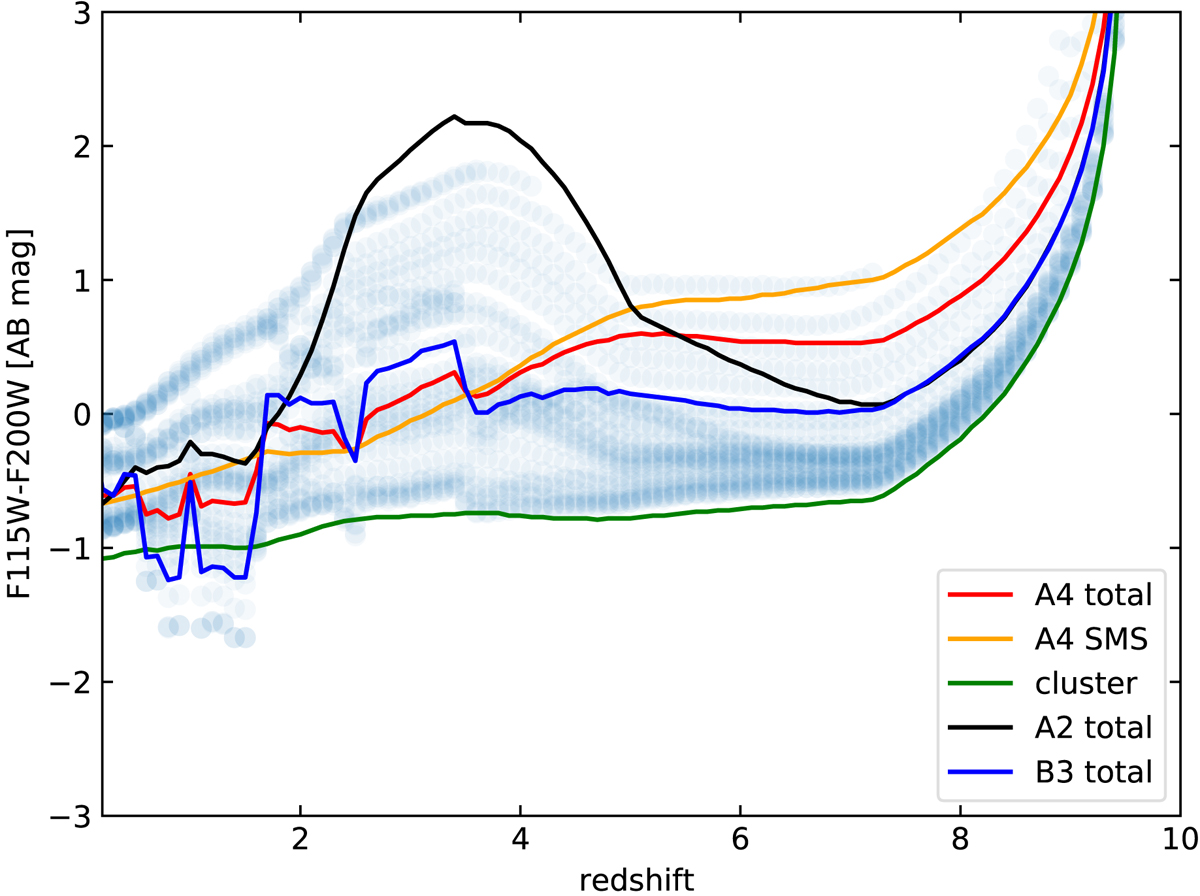
Fig. 14.

Color-redshift plot showing the synthetic F115W-F200W color of the three proto-GC+SMS models and the colors of the different components. The total SEDs are shown with nebular emission, and the cluster model is shown without it. The underlying blue-gray points show the synthetic color of SSPs (clusters) of ages from zero to the maximum allowed age at each redshift.
Current usage metrics show cumulative count of Article Views (full-text article views including HTML views, PDF and ePub downloads, according to the available data) and Abstracts Views on Vision4Press platform.
Data correspond to usage on the plateform after 2015. The current usage metrics is available 48-96 hours after online publication and is updated daily on week days.
Initial download of the metrics may take a while.


