Fig. 13.
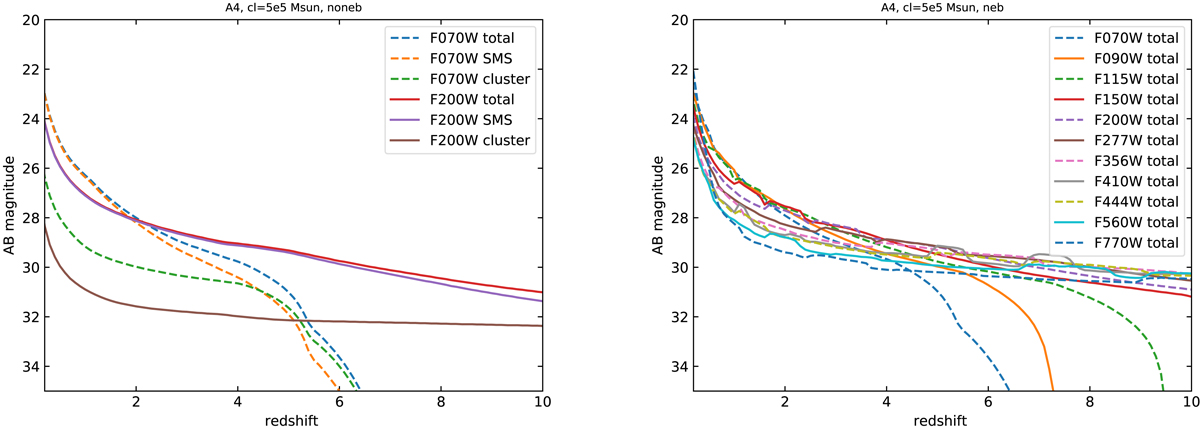
Left: predicted F070W and F200W magnitudes for model A4 as a function of redshift showing the contributions of the stellar cluster (without nebular emission), the SMS, and the total spectrum. Right: predicted magnitudes in the selected NIRCAM+MIRI filters from 0.7–7.7 micron for the same proto-GC + SMS model. The small fluctuations in the different bands are due to nebular emission features. The three curves that drop out are due to the classical photometric drop-out from the shortest wavelengths filters.
Current usage metrics show cumulative count of Article Views (full-text article views including HTML views, PDF and ePub downloads, according to the available data) and Abstracts Views on Vision4Press platform.
Data correspond to usage on the plateform after 2015. The current usage metrics is available 48-96 hours after online publication and is updated daily on week days.
Initial download of the metrics may take a while.