Fig. 10.
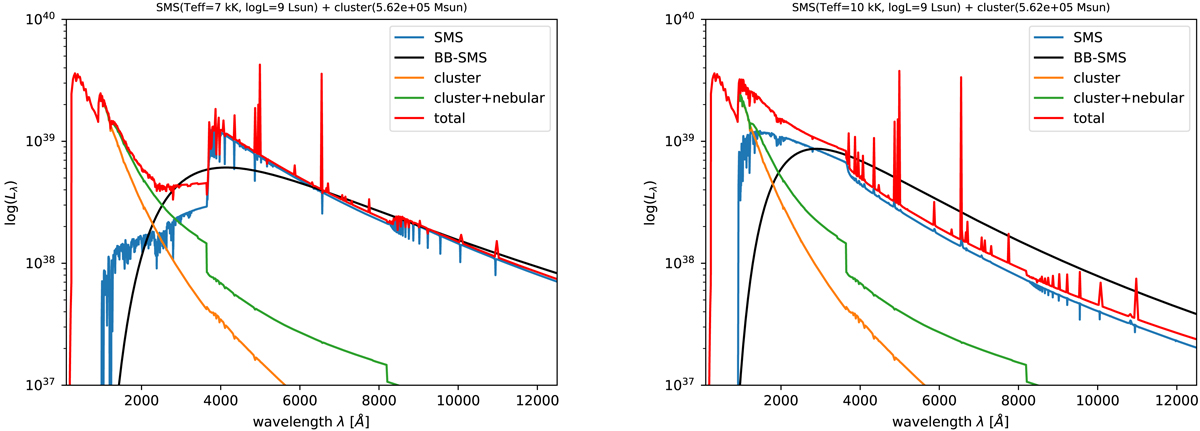
Spectral energy distributions of proto-GCs containing a cool SMS (blue lines show model A2 on the left, and model A4 on the right) plus a normal young stellar population (orange). The green curve indicates the nebular continuum emission from the young population. The total spectrum, also including nebular emission lines, is shown in red. The black curve shows a blackbody with the same Teff and L as the SMS. The clear dominance of the SMS spectrum at wavelengths λ ≳ 3000 (1250) Å for model A2 (A4) is obvious.
Current usage metrics show cumulative count of Article Views (full-text article views including HTML views, PDF and ePub downloads, according to the available data) and Abstracts Views on Vision4Press platform.
Data correspond to usage on the plateform after 2015. The current usage metrics is available 48-96 hours after online publication and is updated daily on week days.
Initial download of the metrics may take a while.