Fig. 1.
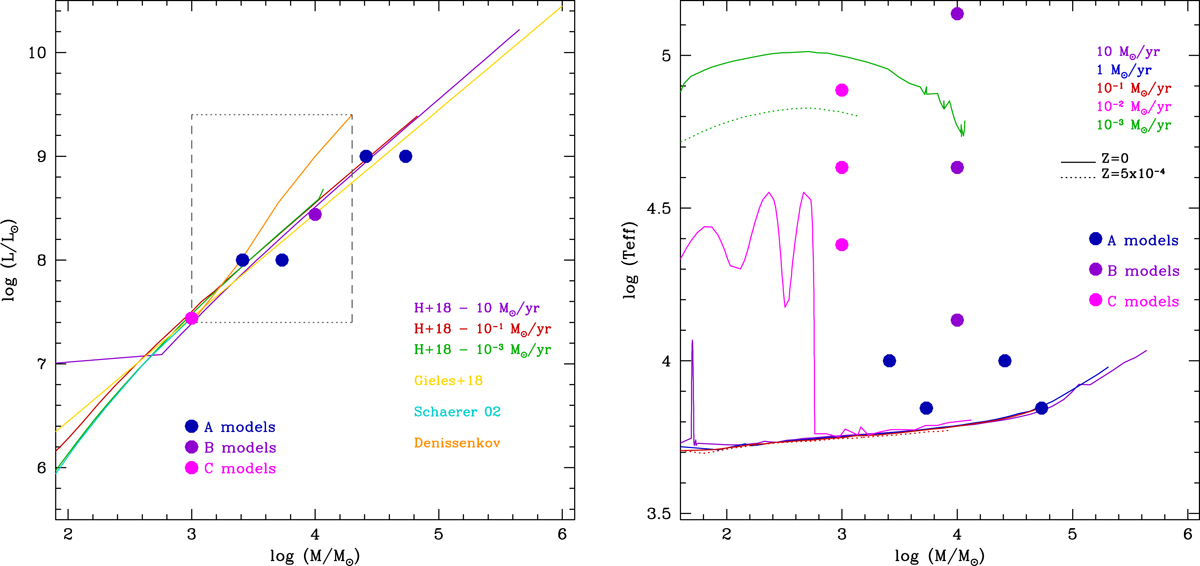
Left: mass-luminosity relation (in solar units) adopted by Gieles et al. (2018a) compared to the predictions of the Pop III models of Schaerer (2002) and of Haemmerlé et al. (2018a, -H+18) for three different accretion rates and of the Pop II ZAMS models of Denissenkov et al. (priv. comm. see Prantzos et al. 2017). The vertical dashed lines show the mass limits that are allowed for nucleosynthesis; see text. The horizontal dotted lines show the minimum and maximum luminosities in this mass interval, according to all M-L relations. Right: mass-effective temperature relations of Haemmerlé et al. (2018a) for various accretion rates and two metallicities. In both panels the filled circles show the positions of our models.
Current usage metrics show cumulative count of Article Views (full-text article views including HTML views, PDF and ePub downloads, according to the available data) and Abstracts Views on Vision4Press platform.
Data correspond to usage on the plateform after 2015. The current usage metrics is available 48-96 hours after online publication and is updated daily on week days.
Initial download of the metrics may take a while.