Fig. 7.
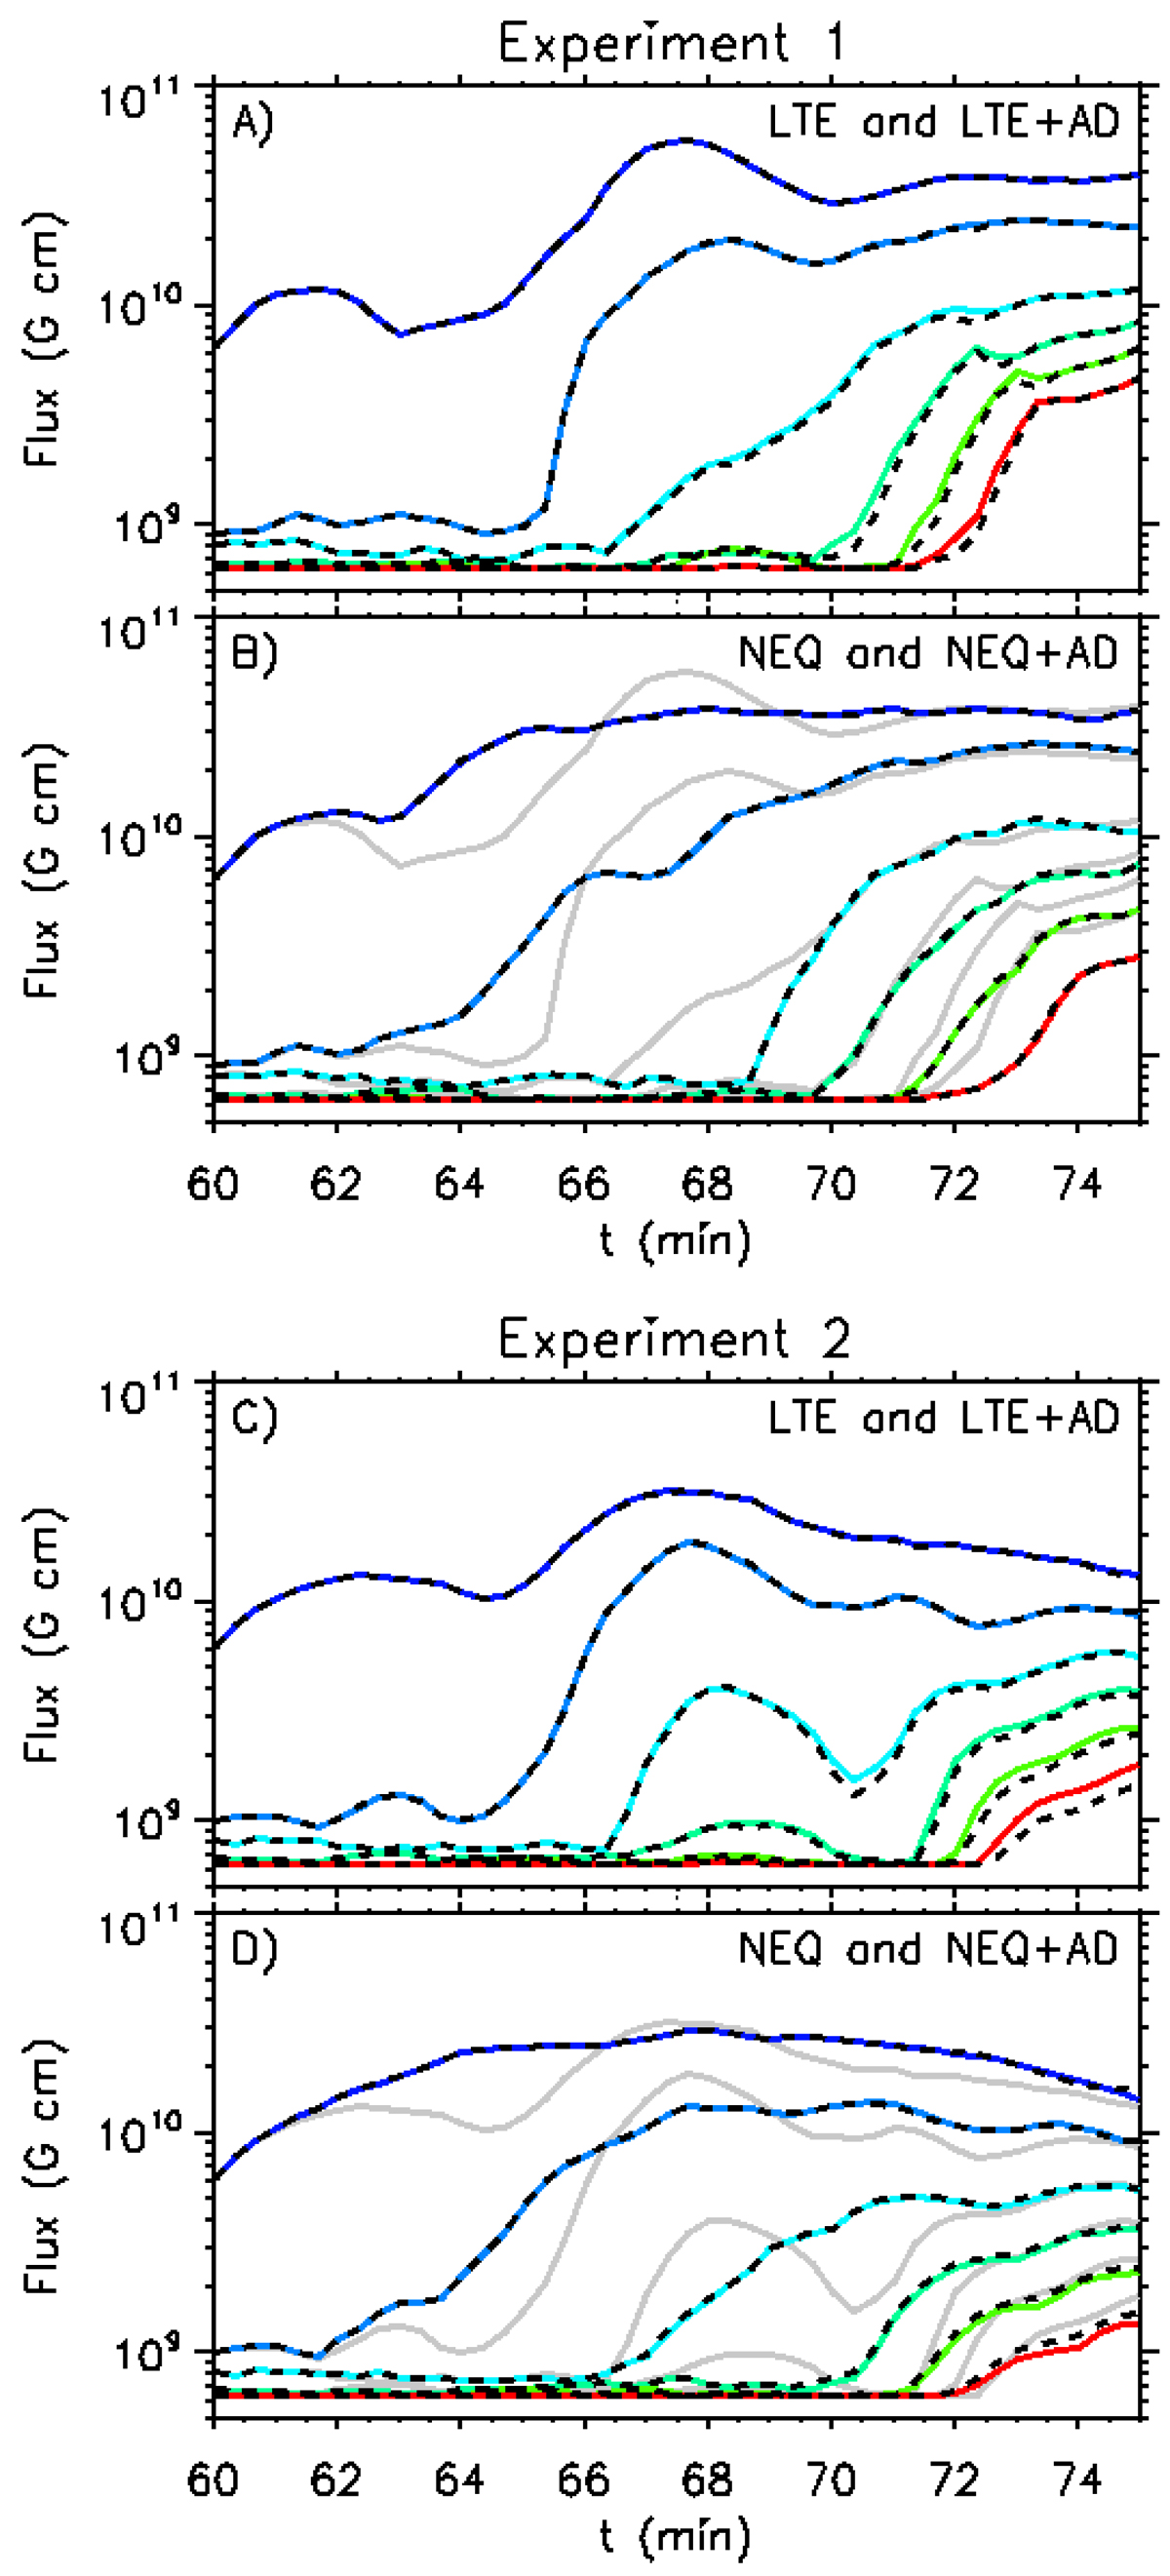
Unsigned vertical flux Φ as a function of time during the flux emergence process for Experiment 1 (panels A and B) and Experiment 2 (panels C and D) for different heights, namely, z = [0.5,1.0,2.0,3.0,4.0,5.0] Mm. The LTE panel for each experiment contains ![]() (colored lines) and ΦLTE (superimposed dashed lines). The NEQ panels show
(colored lines) and ΦLTE (superimposed dashed lines). The NEQ panels show ![]() (colored lines), ΦNEQ superimposed dashed lines) and also
(colored lines), ΦNEQ superimposed dashed lines) and also ![]() (gray lines) to compare with the NEQ cases.
(gray lines) to compare with the NEQ cases.
Current usage metrics show cumulative count of Article Views (full-text article views including HTML views, PDF and ePub downloads, according to the available data) and Abstracts Views on Vision4Press platform.
Data correspond to usage on the plateform after 2015. The current usage metrics is available 48-96 hours after online publication and is updated daily on week days.
Initial download of the metrics may take a while.