Fig. 6.
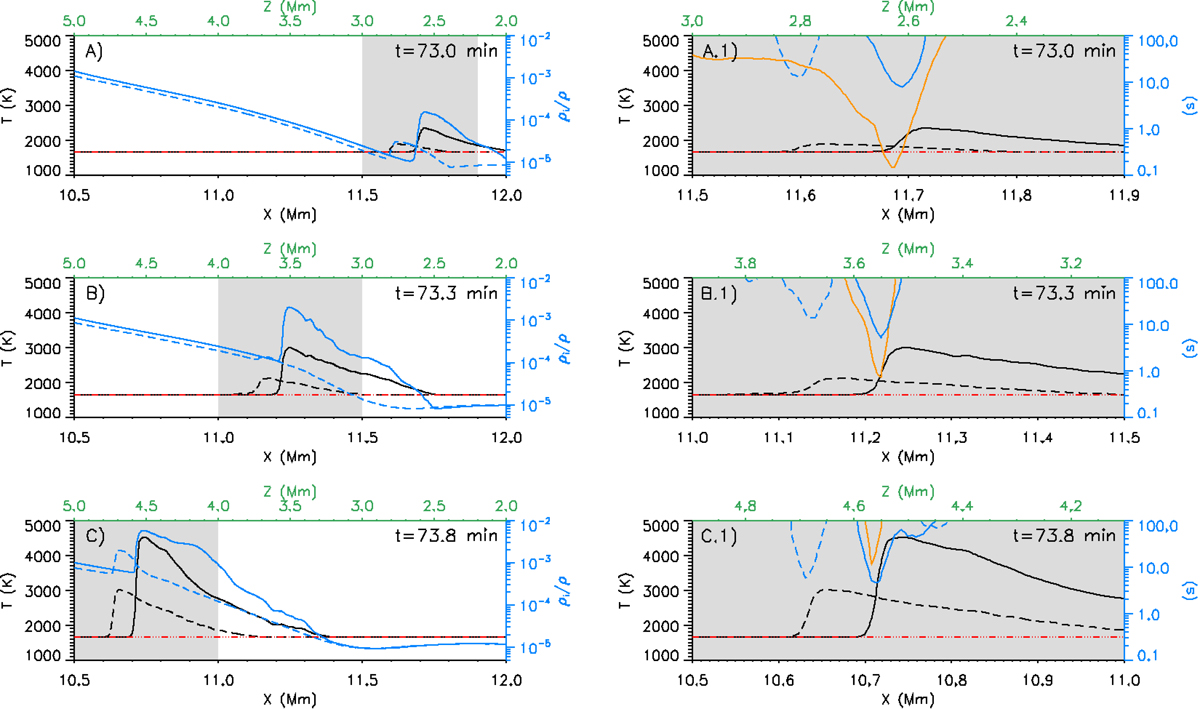
Evolution of different quantities along the cut plotted in Fig. 5 for the same instants reproduced in that image. The x and z coordinates along that line are given as abscissas in the bottom and top axes, respectively. Left panels: evolution of the temperature T (black lines, left axis) and ionization fraction ρi/ρ (blue lines, right axis) for the NEQ case (long dashed lines) and NEQ+AD (solid ones). Right panels: zoom of the gray region of the left panels. The curves are for the temperature (black), and the characteristic times τcomp (blue) and τqamb (orange), keeping the long dashed lines for the purely NEQ case and solid lines for the NEQ + AD one. The tick-marks for the temperature are given on the left axis, and those for the times on the right axis. For all panels, the threshold temperature, T = 1660 K, is shown with a horizontal dash-dotted line in red.
Current usage metrics show cumulative count of Article Views (full-text article views including HTML views, PDF and ePub downloads, according to the available data) and Abstracts Views on Vision4Press platform.
Data correspond to usage on the plateform after 2015. The current usage metrics is available 48-96 hours after online publication and is updated daily on week days.
Initial download of the metrics may take a while.