Fig. 5.
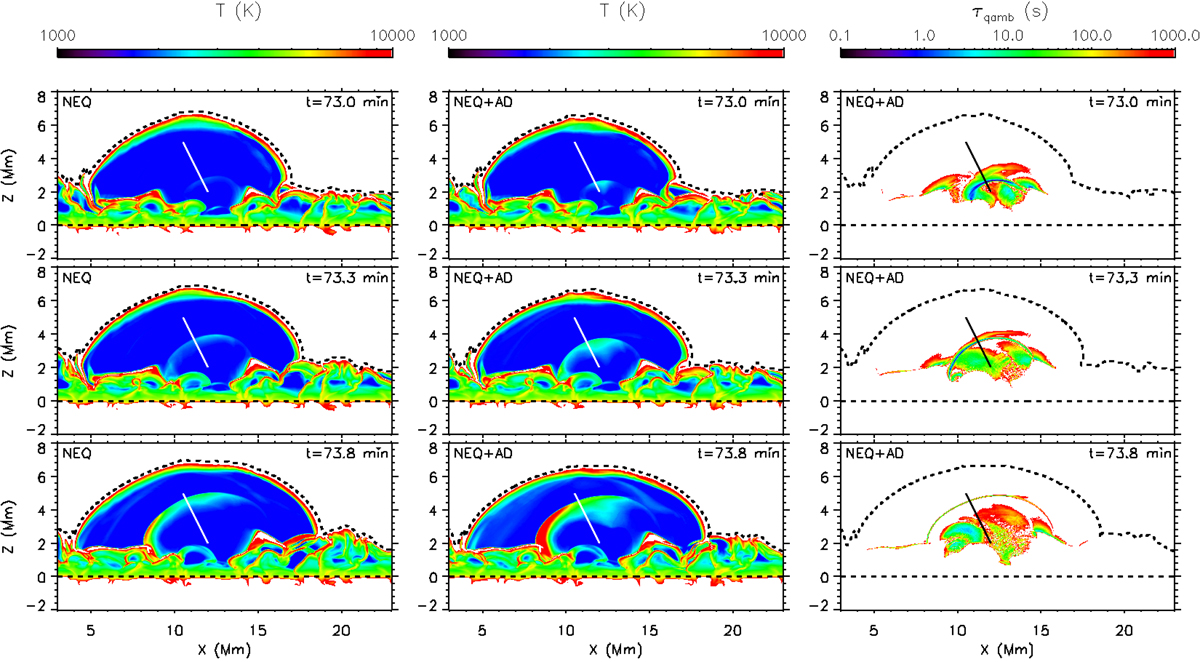
Shock evolution within the emerged region for the Experiment 2 at different instants (rows). Left column: temperature, T, for the NEQ branch; middle column: T for the NEQ+AD case; and right column: characteristic time of the heating due to ambipolar diffusion, τqamb (see Eq. (9)). In addition, a solid line nearly perpendicular to the shock front has been superimposed in all the panels to study the variation of different quantities due to the shock passage (see Fig. 6). In the image, dashed lines indicate the location of the solar surface (line at z = 0 Mm) and of the transition region (isocontour at T = 105 K). An animation of this figure is available online.
Current usage metrics show cumulative count of Article Views (full-text article views including HTML views, PDF and ePub downloads, according to the available data) and Abstracts Views on Vision4Press platform.
Data correspond to usage on the plateform after 2015. The current usage metrics is available 48-96 hours after online publication and is updated daily on week days.
Initial download of the metrics may take a while.