Fig. 4.
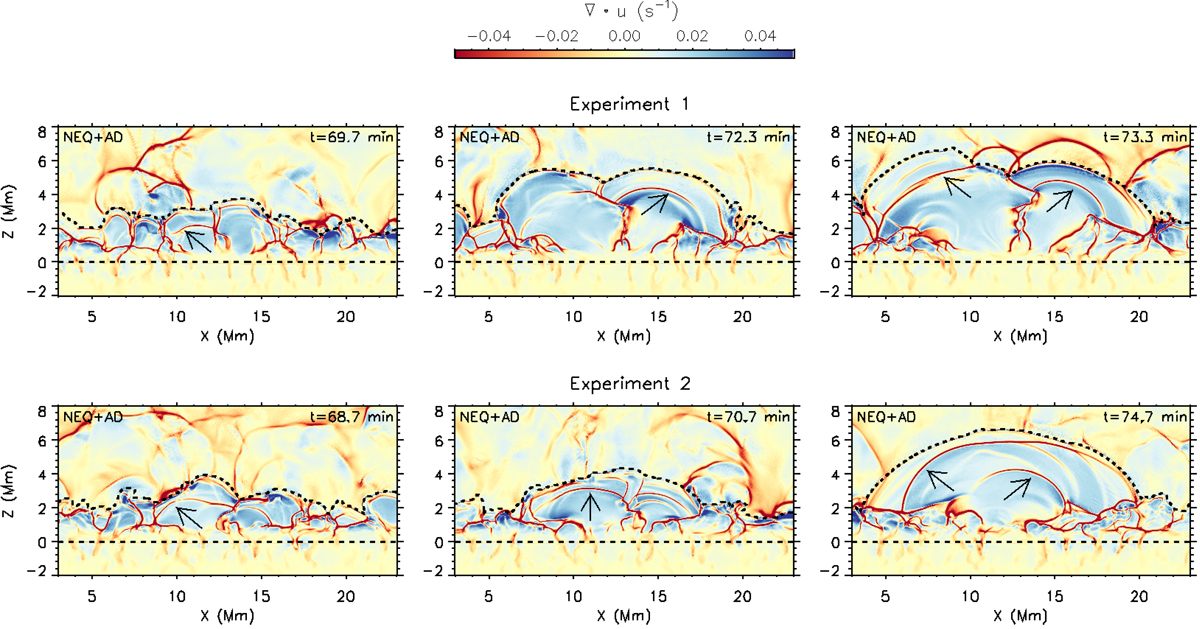
Divergence of the plasma velocity field, ∇ ⋅ u, for Experiments 1 (top) and 2 (bottom) at different stages of the magnetic flux emergence process. Arrows are superimposed pointing out the location of some of the shocks within the emerged regions. Dashed lines indicate the location of the solar surface (line at z = 0 Mm) and of the transition region (isocontour at T = 105 K). An animation of this figure is available online.
Current usage metrics show cumulative count of Article Views (full-text article views including HTML views, PDF and ePub downloads, according to the available data) and Abstracts Views on Vision4Press platform.
Data correspond to usage on the plateform after 2015. The current usage metrics is available 48-96 hours after online publication and is updated daily on week days.
Initial download of the metrics may take a while.