Fig. 3.
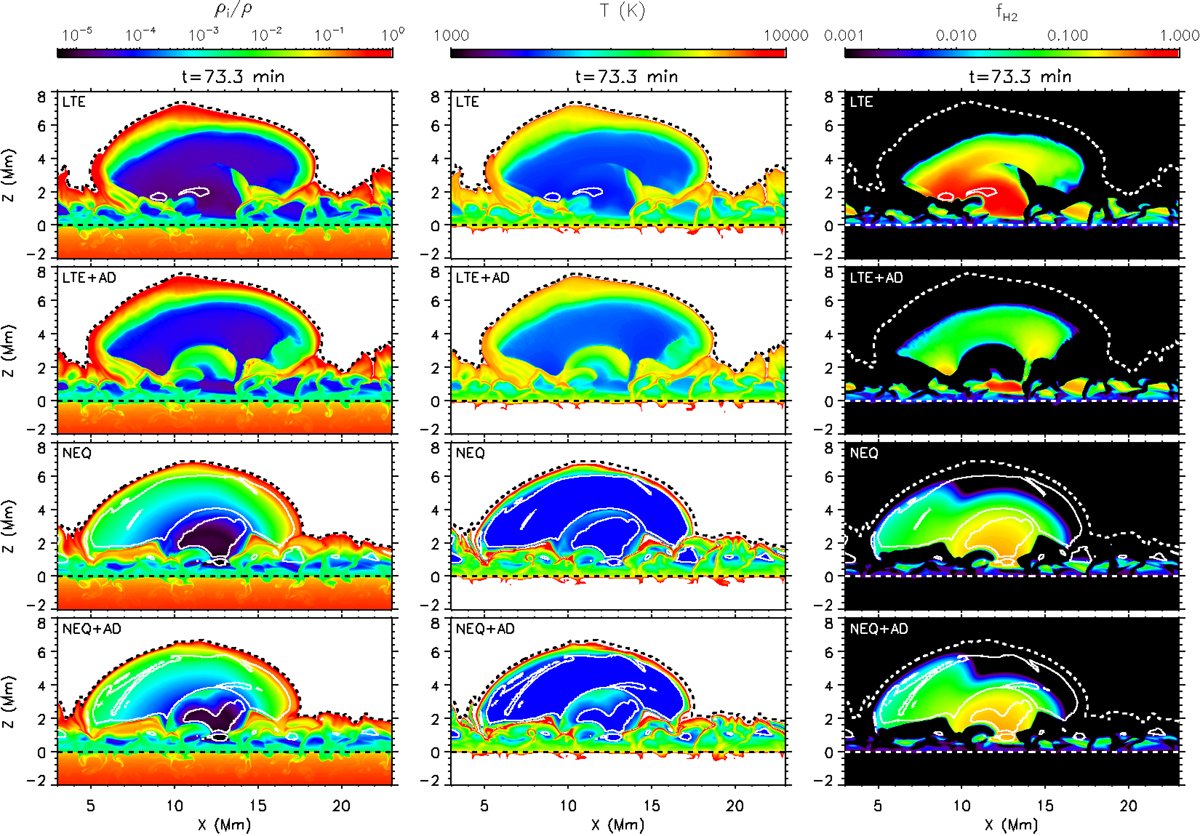
Emerged region for Experiment 2. The rows contain the four branches of this experiment, namely, in descending order, LTE, LTE+AD, NEQ, NEQ+AD. From left to right columns: ionization fraction, ρi/ρ; the temperature, T; and the fraction of molecular hydrogen, fH2. Dashed lines indicate the location of the solar surface (line at z = 0 Mm) and of the transition region (isocontour at T = 105 K). Solid white isocontours delimit the temperature threshold limit at T = 1660 K. An animation of this figure is available online.
Current usage metrics show cumulative count of Article Views (full-text article views including HTML views, PDF and ePub downloads, according to the available data) and Abstracts Views on Vision4Press platform.
Data correspond to usage on the plateform after 2015. The current usage metrics is available 48-96 hours after online publication and is updated daily on week days.
Initial download of the metrics may take a while.