Fig. 1.
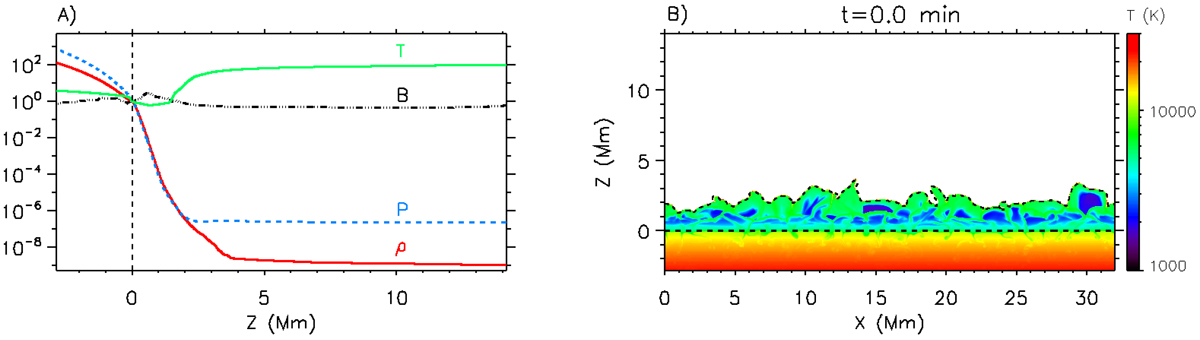
Properties of the initial snapshot (t = 0 min). Panel A: horizontal averages of the initial stratification for temperature T (green), magnetic field strength B (black), pressure P (blue) and density ρ (red) normalized to their photospheric values at z = 0 Mm (Tph = 5803 K, Bph = 0.44 G, Pph = 1.12 × 10⁵ erg cm−3, and ρph = 3.20 × 10⁻⁷ g cm−3). The dotted vertical line delineates the solar surface. Panel B: 2D map for the initial background stratification of the temperature only showing values below T = 3 × 10⁴ K. The solar surface is roughly at z = 0 Mm (dashed horizontal black line). The other dashed line is an isocontour that delimits the transition region at T = 105 K.
Current usage metrics show cumulative count of Article Views (full-text article views including HTML views, PDF and ePub downloads, according to the available data) and Abstracts Views on Vision4Press platform.
Data correspond to usage on the plateform after 2015. The current usage metrics is available 48-96 hours after online publication and is updated daily on week days.
Initial download of the metrics may take a while.