Fig. 6
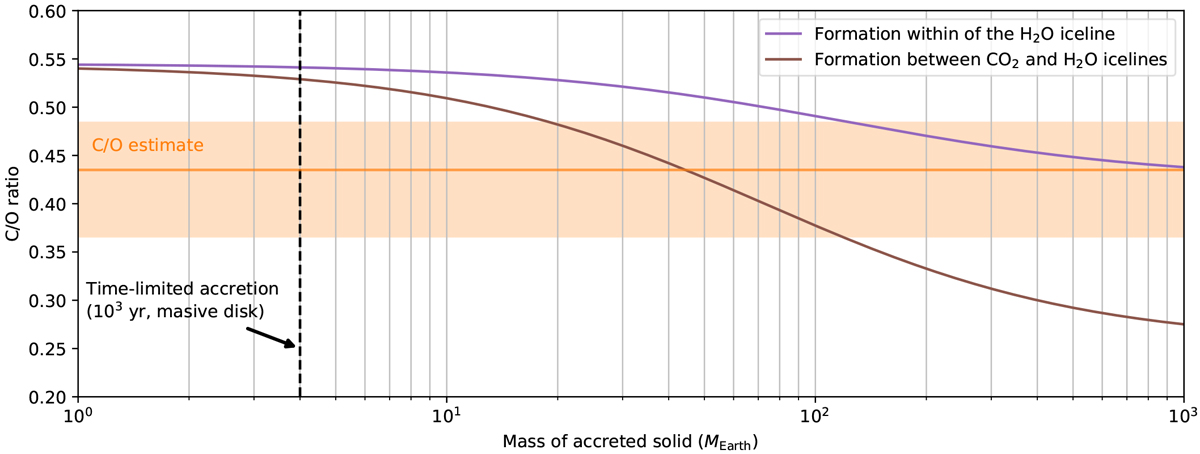
Gravitational collapse scenario: evolution of the C/O ratio as a function of the total mass of solid accreted after the initial formation of the protoplanet. The purple curve corresponds to a formation within the H2O iceline, and the brown curve to a formation between the H2O and CO2 icelines. The orange area gives the 68% confidence interval for the value of the C/O ratio. Dashed vertical lines corresponds to different solid accretion limits discussed in the text.
Current usage metrics show cumulative count of Article Views (full-text article views including HTML views, PDF and ePub downloads, according to the available data) and Abstracts Views on Vision4Press platform.
Data correspond to usage on the plateform after 2015. The current usage metrics is available 48-96 hours after online publication and is updated daily on week days.
Initial download of the metrics may take a while.