Fig. 5
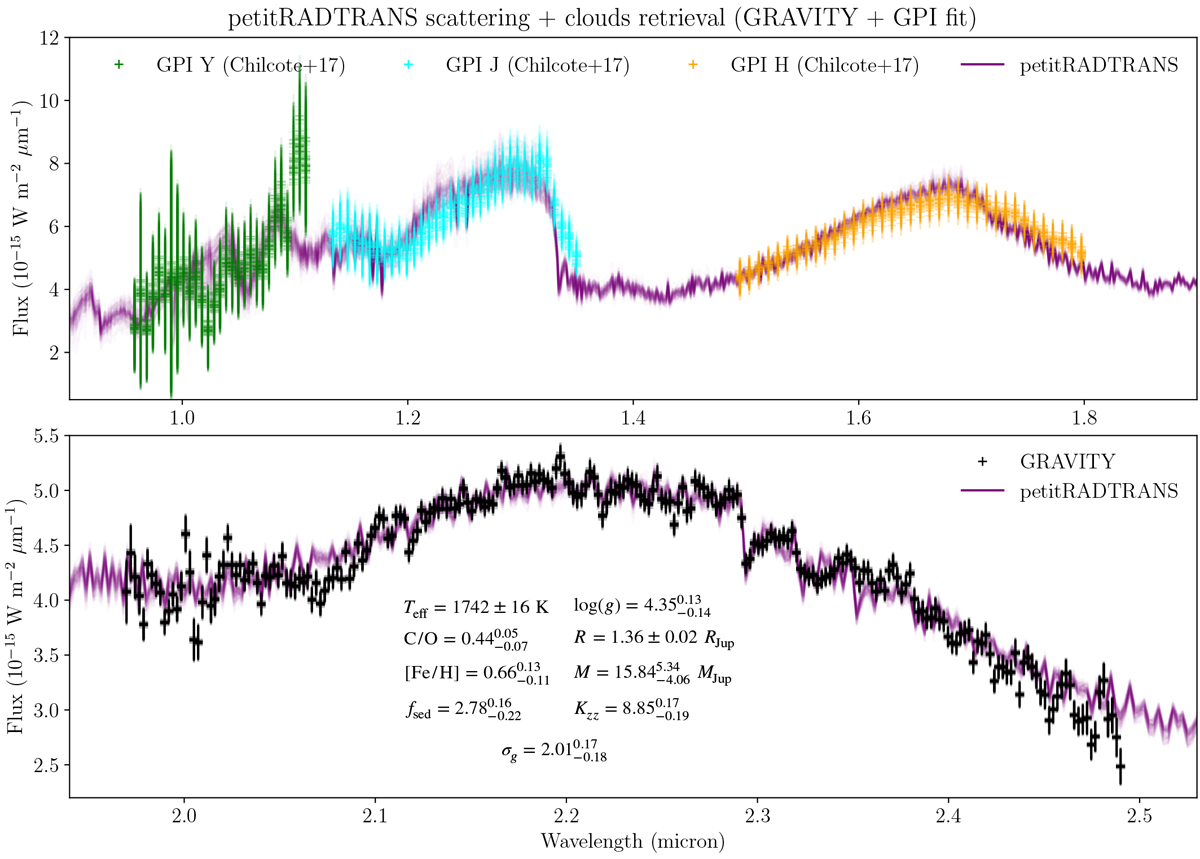
Results of the combined (GRAVITY+GPI) fit of the β Pic b spectrum with petitRADTRANS. No prior on the mass was used in the fit, and the spectroscopically retrieved mass is consistent with the astrometric value. For producing this plot, 100 samples were drawn from the posterior distribution, for both the model and the data scaling. The 2-d projection of the posterior can be found in Appendix B. Top panel: GPI Y, J and H-band data of Chilcote et al. (2017) are plotted as green, cyan, and orange points with error bars, respectively, the petitRADTRANS models are plotted as purple solid lines. The fit is dominated by the high S/N of the GRAVITY data (shown in the bottom panel), leading to a worse fit in the GPI bands, see text. Bottom panel: GRAVITY data are shown as black points with errorbars, the petitRADTRANS models are plotted as purple solid lines.
Current usage metrics show cumulative count of Article Views (full-text article views including HTML views, PDF and ePub downloads, according to the available data) and Abstracts Views on Vision4Press platform.
Data correspond to usage on the plateform after 2015. The current usage metrics is available 48-96 hours after online publication and is updated daily on week days.
Initial download of the metrics may take a while.