Fig. 9
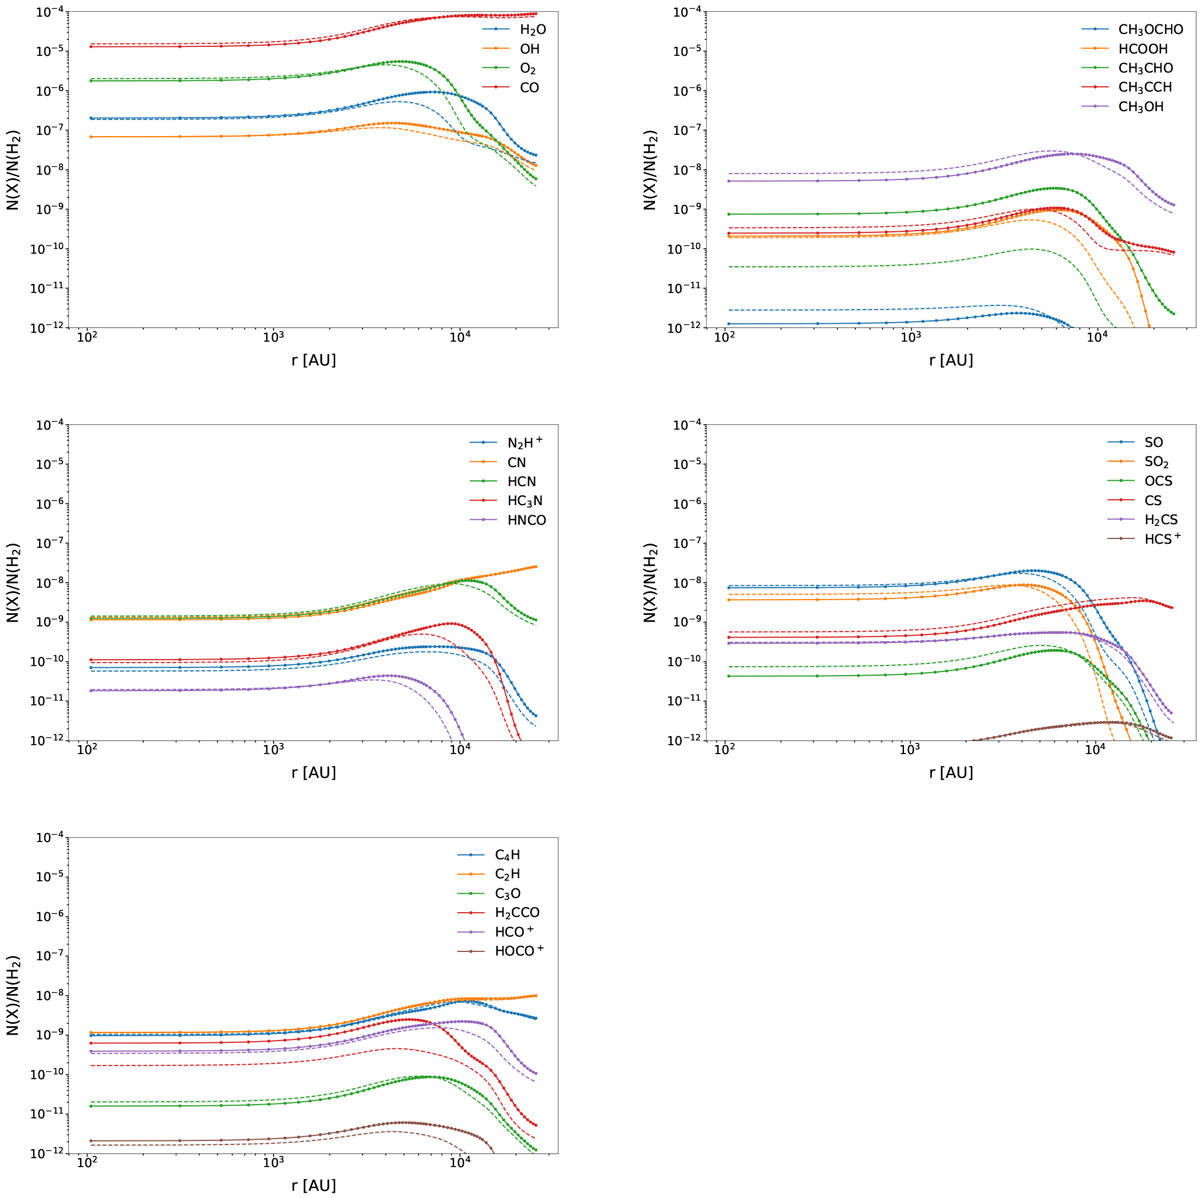
Radial profiles of abundances of species obtained with the updated model, in the text labelled as “Model 3” (solid), and with the original model (dashed) developed in Vasyunin et al. (2017). The profiles were obtained at the “best-fit ” time of 9.5 × 10⁴ yr. For each radial point, the column densities of the species are divided by the corresponding column density of hydrogen (see Fig. 1). Then, convolution over 26′′ Gaussian beam is performed to mimic IRAM 30 m observations.
Current usage metrics show cumulative count of Article Views (full-text article views including HTML views, PDF and ePub downloads, according to the available data) and Abstracts Views on Vision4Press platform.
Data correspond to usage on the plateform after 2015. The current usage metrics is available 48-96 hours after online publication and is updated daily on week days.
Initial download of the metrics may take a while.