Fig. 3
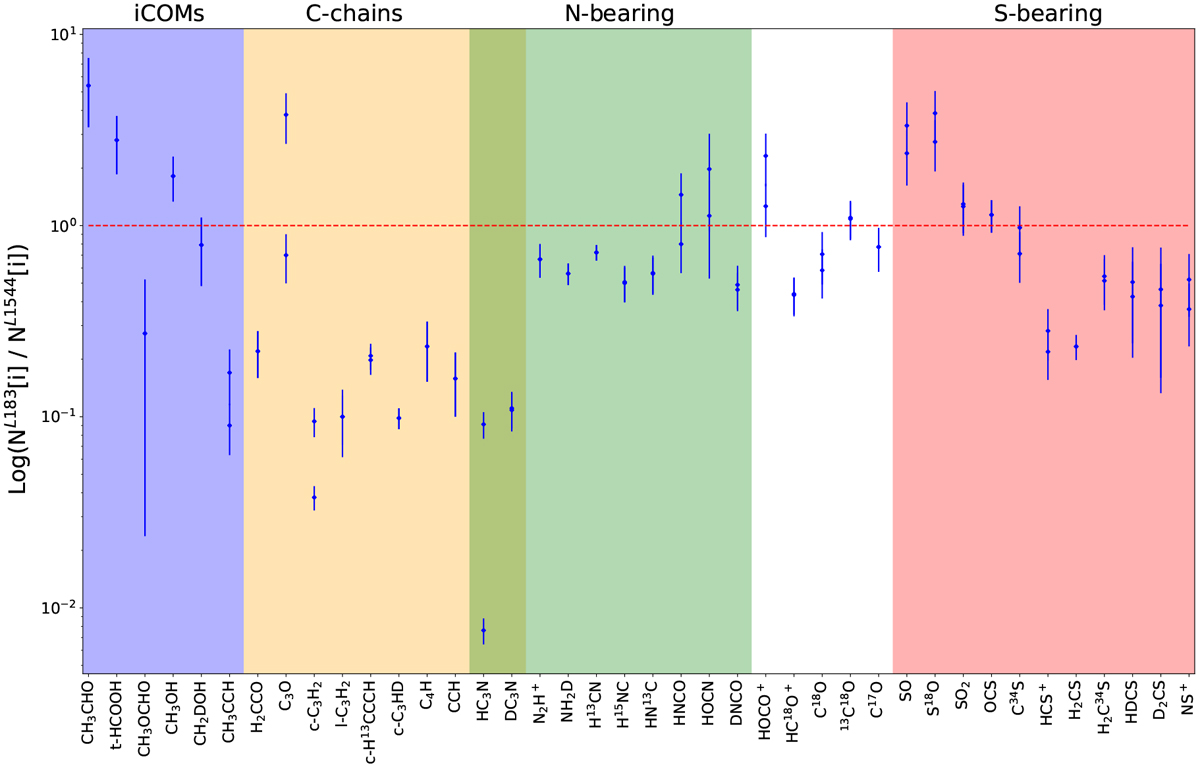
Logarithmic column density ratios of L183 relative to L1544. Where no uncertainty was provided in the literature data (see Table B.2), an error of 25% of the reported column density was assigned for the error bars in the plot. In cases where the column density was derived for two temperatures, both ratios are shown for the same species. The red dashed line represents the ratio equal to unity.
Current usage metrics show cumulative count of Article Views (full-text article views including HTML views, PDF and ePub downloads, according to the available data) and Abstracts Views on Vision4Press platform.
Data correspond to usage on the plateform after 2015. The current usage metrics is available 48-96 hours after online publication and is updated daily on week days.
Initial download of the metrics may take a while.