Fig. 1
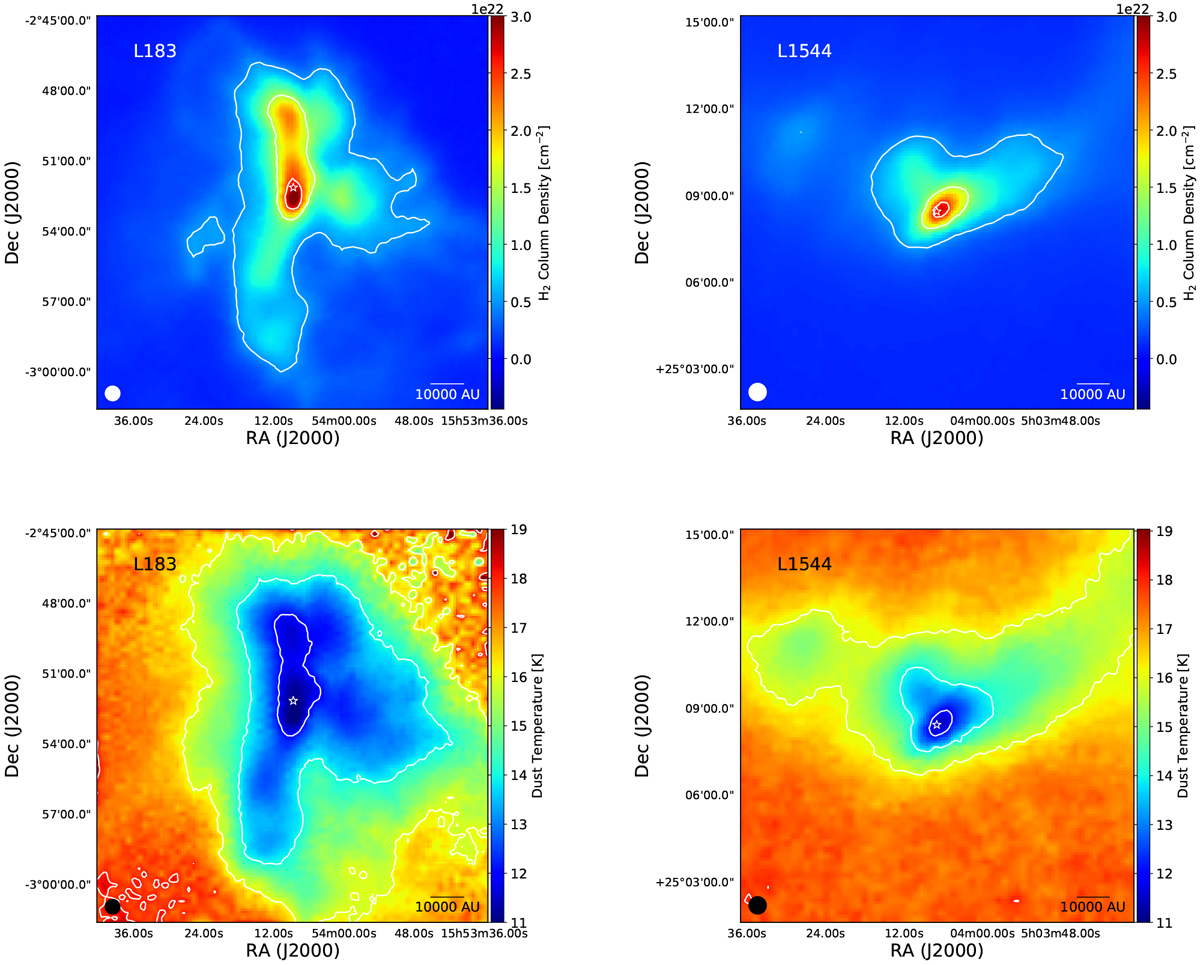
Herschel/SPIRE maps, at the same linear scale, of the H2 column density (top row) and dust temperature (bottom row) in L183 (left column) and L1544 (right column). The beam of SPIRE is shown as a white (top row) and black (bottom row) circle in the bottom-left corner. The white star in the middle of L183 figures represents our pointing, while the one in L1544 identifies the dust peak of the source. White contours are 0.5, 1.5, 2.5 × 1022 cm−2 for the H2 column density (top row) maps and 12, 14, 16, 18 K for the dust temperature (bottom row) maps, respectively.
Current usage metrics show cumulative count of Article Views (full-text article views including HTML views, PDF and ePub downloads, according to the available data) and Abstracts Views on Vision4Press platform.
Data correspond to usage on the plateform after 2015. The current usage metrics is available 48-96 hours after online publication and is updated daily on week days.
Initial download of the metrics may take a while.