Fig. 9
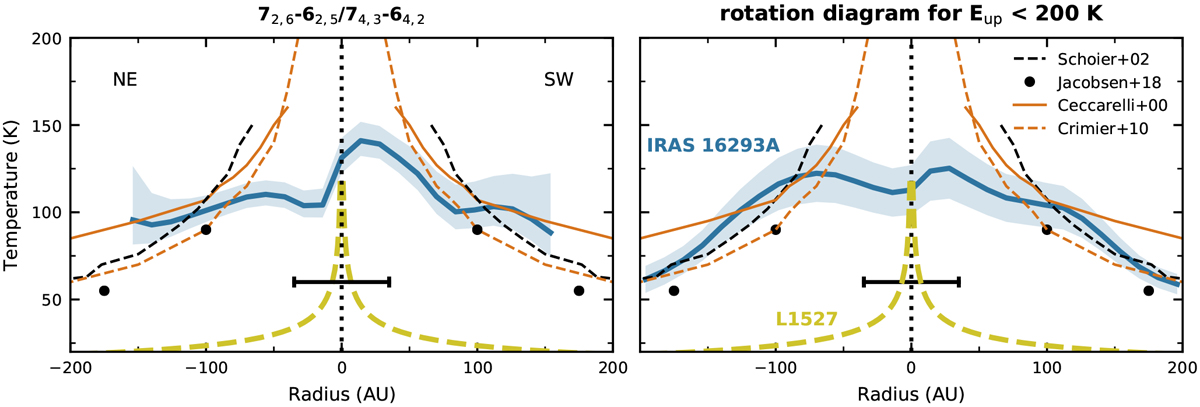
Radial temperature profiles for IRAS 16293A derived in this work from H2 CS transitions (blue lines) compared to dust (black lines and circles) and gas (orange lines) temperature profiles from the literature. The H2CS temperature profile in the left panel is derived from the 72,6–62,5/74,3–64,2 line ratio and the profile in the right panel is based on fits to the peak flux rotation diagrams including only transitions with Eup < 200 K. The blue shaded area represents the 1σ uncertainty. The dashed black line shows the IRAS 16293 dust temperature assuming an envelope around a central source of 27 L⊙ (Schöier et al. 2002), and the black dots represents dust temperature contours for IRAS 16293A from detailed modeling including both protostars and the bridge structure (Jacobsen et al. 2018). The gas temperatures are based on H2 O observations with the ISO satellite using a model that computes the gas temperature through an envelope by solving a chemical network and equating the heating and cooling rates (Ceccarelli et al. 1996). The solid orange line shows the initial results assuming a single 27 L⊙ protostar at 160 pc (Ceccarelli et al. 2000), the dashed orange line presents the revised results for a 22 L⊙ protostar at 120 pc (Crimier et al. 2010). The dashed yellow line shows the midplane gas temperature for the Class 0/I disk L1527 based on optically thick 13CO and C18O emission (van ’t Hoff et al. 2018). The horizontal bar marks the beam size of the H2 CS observations.
Current usage metrics show cumulative count of Article Views (full-text article views including HTML views, PDF and ePub downloads, according to the available data) and Abstracts Views on Vision4Press platform.
Data correspond to usage on the plateform after 2015. The current usage metrics is available 48-96 hours after online publication and is updated daily on week days.
Initial download of the metrics may take a while.