Fig. 8
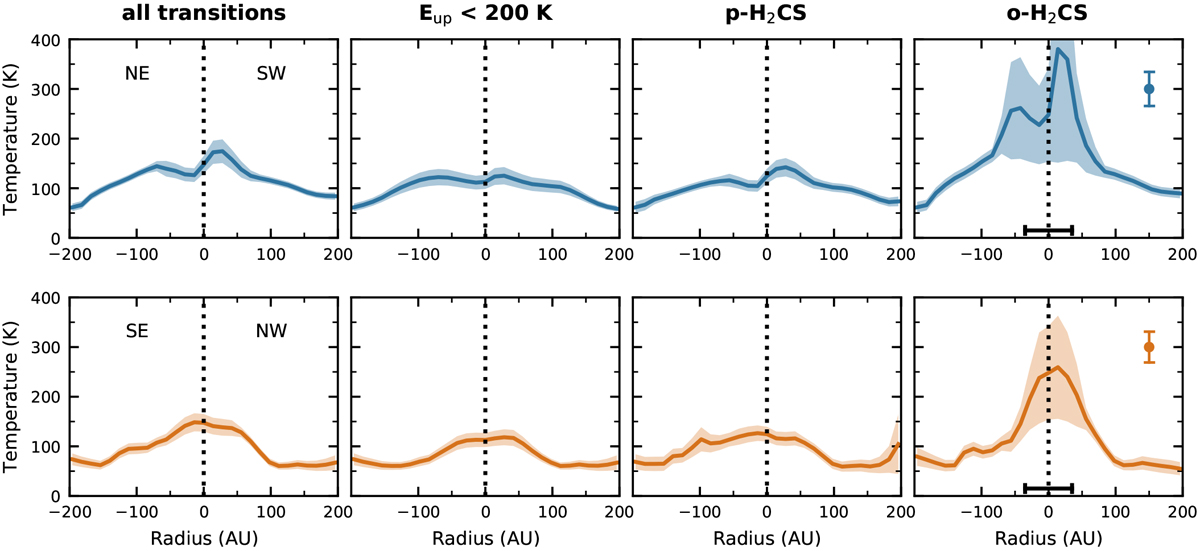
Radial temperature profiles derived from the rotation diagrams including all transitions (first column), only transitions with Eup < 200 K (second column), only para transitions (third column), or only ortho transitions (fourth column). Top row: radial profiles along the major axis of the disk-like structure (PA = 45°), bottom row: profiles along the minor axis. The shaded area represents the 1σ uncertainty. The vertical bar in the right panels shows a typical 3σ error for theinner 100 AU and the horizontal bar marks the beam size.
Current usage metrics show cumulative count of Article Views (full-text article views including HTML views, PDF and ePub downloads, according to the available data) and Abstracts Views on Vision4Press platform.
Data correspond to usage on the plateform after 2015. The current usage metrics is available 48-96 hours after online publication and is updated daily on week days.
Initial download of the metrics may take a while.