Fig. 7
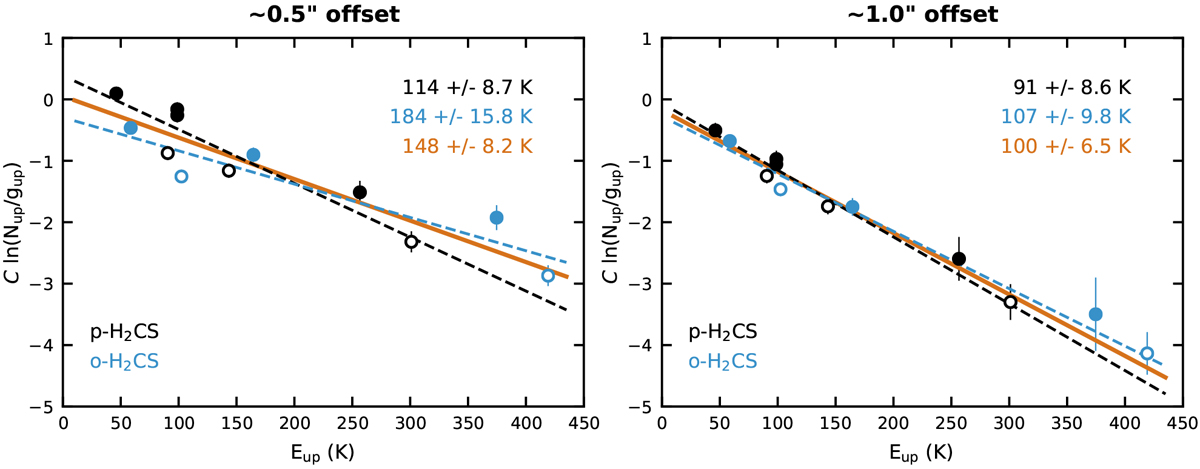
Rotation diagrams for the H2CS peak fluxes along the major axis (PA = 45°) of the disk-like structure at 0.5′′ (left panel) and 1.0′′ (right panel) from the source center. Para transitions are shown in black and ortho transitions in blue. An ortho-to-para ratio of 2 is assumed. J = 7−6 transitions are displayed as filled symbols and J = 10−9 transitions as open symbols. The error bars include a 10% uncertainty. The best fit to all transitions is presented by the solid orange line, whereas the dashed lines show fits to only the ortho (blue) and only the para transitions (black). The corresponding rotation temperatures are listed in the top right corners.
Current usage metrics show cumulative count of Article Views (full-text article views including HTML views, PDF and ePub downloads, according to the available data) and Abstracts Views on Vision4Press platform.
Data correspond to usage on the plateform after 2015. The current usage metrics is available 48-96 hours after online publication and is updated daily on week days.
Initial download of the metrics may take a while.