Fig. 6
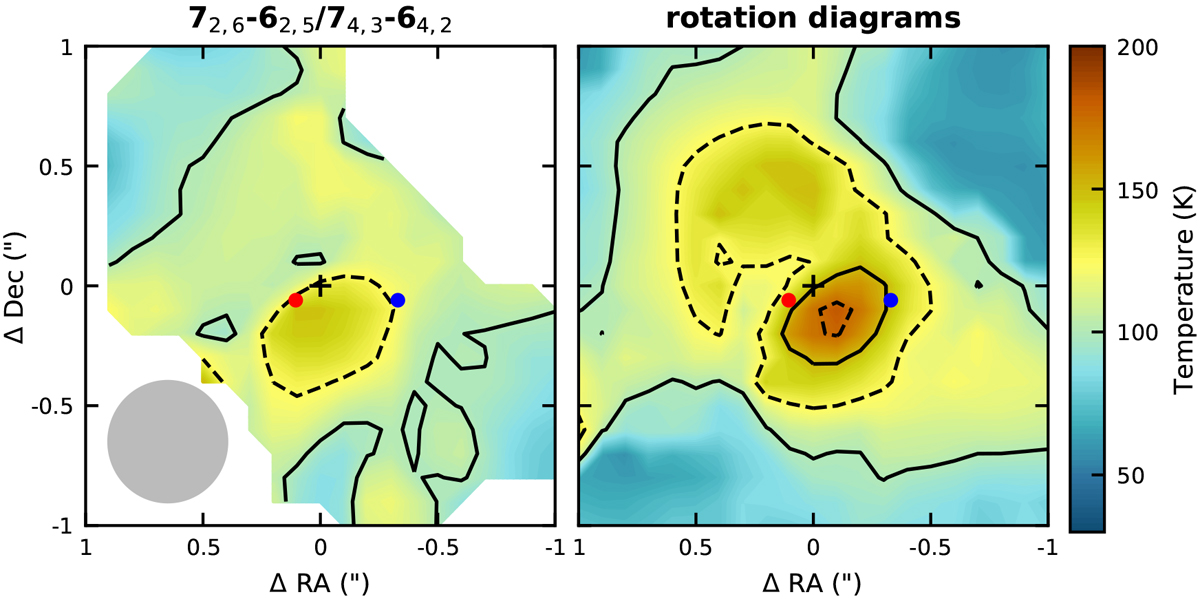
Temperature in a 2′′× 2′′ (280 × 280 AU) region around IRAS 16293A derived from the H2CS 72,6–62,5/74,3–64,2 line ratio (left panel), and from the rotation diagrams in each pixel (right panel). Solid contours indicate temperatures of 100 and 150 K and dashed contours are at 125 and 175 K. The continuum peak position is marked with a black cross. The positions of the unresolved binary components A1 and A2 in 2015 (Hernández-Gómez et al. 2019) are shown with a red and blue circle, resp. The beam is depicted in the lower left corner of the left panel.
Current usage metrics show cumulative count of Article Views (full-text article views including HTML views, PDF and ePub downloads, according to the available data) and Abstracts Views on Vision4Press platform.
Data correspond to usage on the plateform after 2015. The current usage metrics is available 48-96 hours after online publication and is updated daily on week days.
Initial download of the metrics may take a while.