Fig. 4
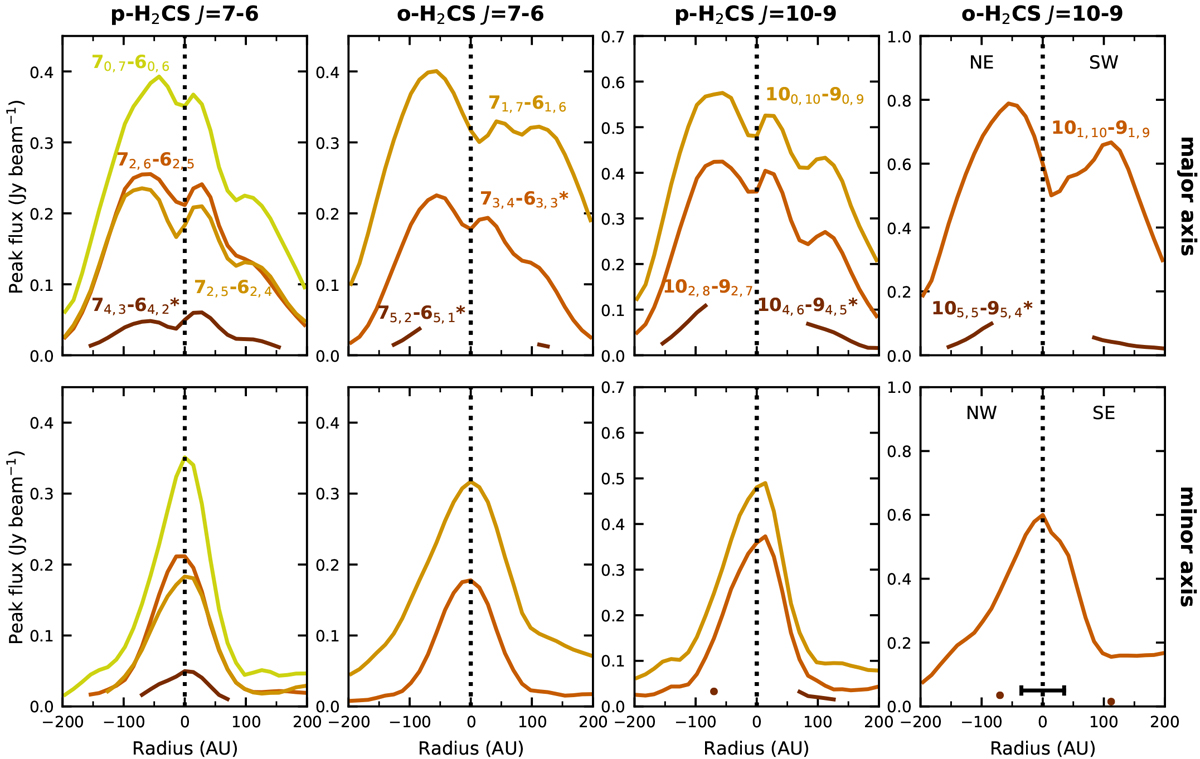
Radial profiles of the H2CS peak fluxes along the major axis (PA = 45°; top panels) and minor axis (PA = 135°; bottom panels) of the disk-like structure. In each panel, transitions with higher upper level energy are plotted in darker colors. Fluxes for transitions labeled with an asterisk (*) have been divided by 2 to account for two transitions with the same upper level energy and Einstein A coefficent at the same frequency (see Table A.1). The horizontal bar in the lower right panel marks the beam size. The rms ranges between 2 and 8 mJy beam−1.
Current usage metrics show cumulative count of Article Views (full-text article views including HTML views, PDF and ePub downloads, according to the available data) and Abstracts Views on Vision4Press platform.
Data correspond to usage on the plateform after 2015. The current usage metrics is available 48-96 hours after online publication and is updated daily on week days.
Initial download of the metrics may take a while.